Estimated Value: $332,508 - $388,000
4
Beds
3
Baths
2,000
Sq Ft
$181/Sq Ft
Est. Value
About This Home
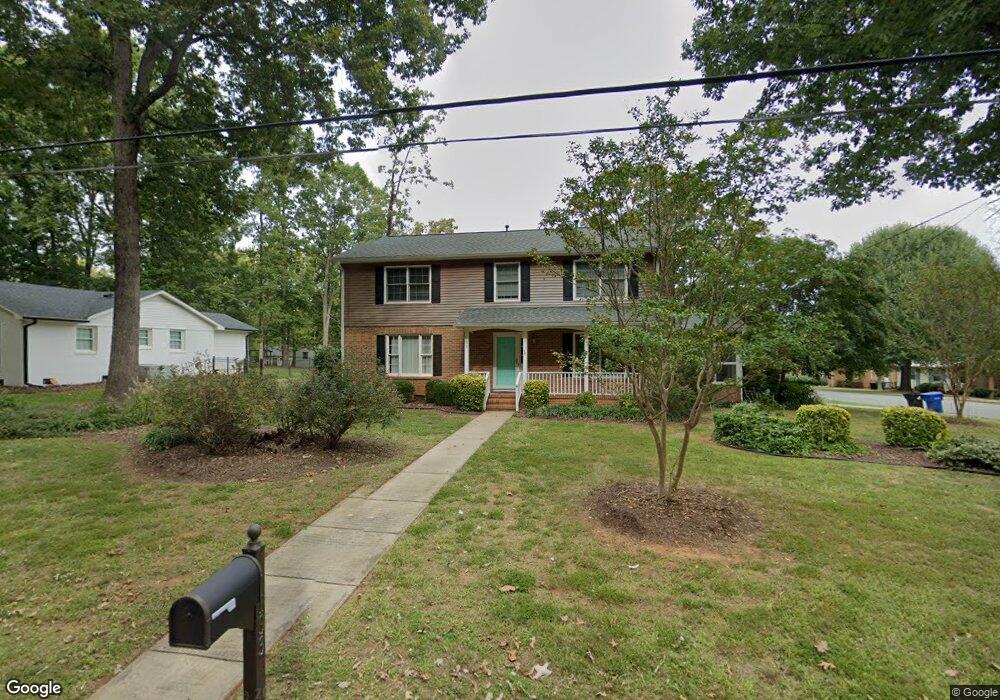
This home is located at 133 Orange Dr, Elon, NC 27244 and is currently estimated at $362,877, approximately $181 per square foot. 133 Orange Dr is a home located in Alamance County with nearby schools including Western Alamance Middle School, Western Alamance High School, and The Burlington School.
Ownership History
Date
Name
Owned For
Owner Type
Purchase Details
Closed on
May 27, 2014
Sold by
Stoughton David H and Stoughton Janice R
Bought by
Dhs Realty Westview Llc
Current Estimated Value
Purchase Details
Closed on
Oct 27, 2006
Sold by
Wells Fargo Bank
Bought by
Stoughton David H
Home Financials for this Owner
Home Financials are based on the most recent Mortgage that was taken out on this home.
Original Mortgage
$139,639
Interest Rate
6.33%
Mortgage Type
New Conventional
Purchase Details
Closed on
May 30, 2001
Sold by
Gantos Charles J
Bought by
Marshall Robert M
Home Financials for this Owner
Home Financials are based on the most recent Mortgage that was taken out on this home.
Original Mortgage
$161,900
Interest Rate
7.05%
Create a Home Valuation Report for This Property
The Home Valuation Report is an in-depth analysis detailing your home's value as well as a comparison with similar homes in the area
Home Values in the Area
Average Home Value in this Area
Purchase History
| Date | Buyer | Sale Price | Title Company |
|---|---|---|---|
| Dhs Realty Westview Llc | -- | -- | |
| Stoughton David H | $156,000 | -- | |
| Marshall Robert M | $180,000 | -- |
Source: Public Records
Mortgage History
| Date | Status | Borrower | Loan Amount |
|---|---|---|---|
| Previous Owner | Stoughton David H | $139,639 | |
| Previous Owner | Stoughton David H | $139,639 | |
| Previous Owner | Marshall Robert M | $161,900 |
Source: Public Records
Tax History
| Year | Tax Paid | Tax Assessment Tax Assessment Total Assessment is a certain percentage of the fair market value that is determined by local assessors to be the total taxable value of land and additions on the property. | Land | Improvement |
|---|---|---|---|---|
| 2025 | $1,541 | $312,033 | $45,000 | $267,033 |
| 2024 | $1,463 | $312,033 | $45,000 | $267,033 |
| 2023 | $2,428 | $312,033 | $45,000 | $267,033 |
| 2022 | $1,836 | $167,739 | $40,000 | $127,739 |
| 2021 | $1,853 | $167,739 | $40,000 | $127,739 |
| 2020 | $1,869 | $167,739 | $40,000 | $127,739 |
| 2019 | $1,875 | $167,739 | $40,000 | $127,739 |
| 2018 | $0 | $167,739 | $40,000 | $127,739 |
| 2017 | $1,728 | $167,739 | $40,000 | $127,739 |
| 2016 | $1,791 | $179,054 | $35,000 | $144,054 |
| 2015 | $1,033 | $179,054 | $35,000 | $144,054 |
| 2014 | $944 | $179,054 | $35,000 | $144,054 |
Source: Public Records
Map
Nearby Homes
- 1012 Mill Pointe Way
- 116 Sunset Dr
- 204 Georgetowne Dr
- 2000 Muirfield Ct
- 3000 Sunningdale Ct
- 115 Georgetowne Dr
- 304 Courtland Dr
- 441 Fieldstone Dr
- 400 Brickwalk Ct
- 3224 Somerton Place
- 413 Courtland Dr
- 2915 Truitt Dr
- 609 Huntingdon St
- 105 Oakview Dr
- 3025 N Fairway Dr
- 6 Willow Oak
- 117 Forestview Dr
- 207 Windrift Dr
- 115 Coachlight Trail
- 313 Westridge Dr
- 129 Orange Dr
- 8 Westminister Dr
- 205 Orange Dr
- 125 Orange Dr
- 130 Orange Dr
- 409 Westminister Dr
- 136 Westview Dr
- 132 Westview Dr
- 126 Orange Dr
- 202 Orange Dr
- 405 Westminister Dr
- 201 Orange Dr
- 128 Westview Dr
- 401 Westminister Dr
- 206 Orange Dr
- 126 Westview Dr
- 8018 Windsor Way
- 8017 Windsor Way
- 313 Westminister Dr
Your Personal Tour Guide
Ask me questions while you tour the home.