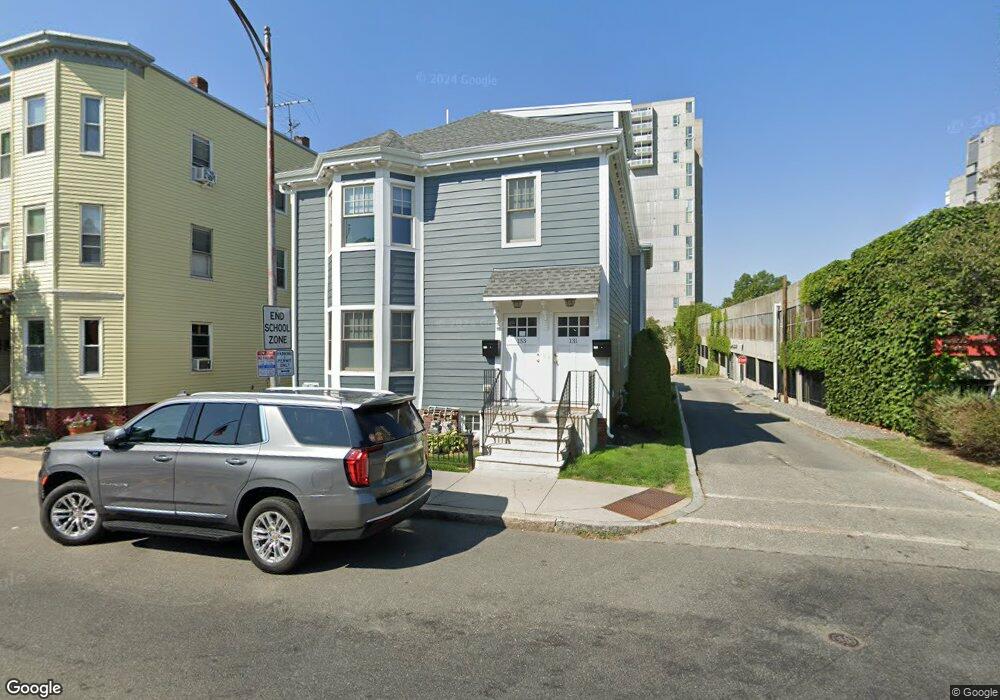
133 Putnam Ave Cambridge, MA 02139
Riverside NeighborhoodEstimated Value: $1,224,000 - $1,482,000
2
Beds
3
Baths
1,412
Sq Ft
$983/Sq Ft
Est. Value
About This Home
This home is located at 133 Putnam Ave, Cambridge, MA 02139 and is currently estimated at $1,387,582, approximately $982 per square foot. 133 Putnam Ave is a home located in Middlesex County with nearby schools including Saint Paul's Choir School and St Herman Of Alaska Christian School.
Ownership History
Date
Name
Owned For
Owner Type
Purchase Details
Closed on
Jul 14, 2023
Sold by
Schreckinger Steven L and Vose Rebecca S
Bought by
133 Putnam Avenue Llc
Current Estimated Value
Purchase Details
Closed on
Jun 2, 2022
Sold by
Schreckinger Anna V
Bought by
Schreckinger Steven L and Vose Rebecca M
Purchase Details
Closed on
Aug 18, 2011
Sold by
Beackfield Jason W and Viterna Joccelyn S
Bought by
Schreckinger Steven L and Schreckinger Anna V
Purchase Details
Closed on
May 30, 2007
Sold by
Al-Rahim Ahmen H and Al-Suwaii Zainab
Bought by
Beckfield Jason W and Viterna Jocelyn S
Home Financials for this Owner
Home Financials are based on the most recent Mortgage that was taken out on this home.
Original Mortgage
$468,000
Interest Rate
6%
Mortgage Type
Purchase Money Mortgage
Create a Home Valuation Report for This Property
The Home Valuation Report is an in-depth analysis detailing your home's value as well as a comparison with similar homes in the area
Home Values in the Area
Average Home Value in this Area
Purchase History
| Date | Buyer | Sale Price | Title Company |
|---|---|---|---|
| 133 Putnam Avenue Llc | -- | None Available | |
| 133 Putnam Avenue Llc | -- | None Available | |
| Schreckinger Steven L | $280,000 | None Available | |
| Schreckinger Steven L | $280,000 | None Available | |
| Schreckinger Steven L | $619,000 | -- | |
| Schreckinger Steven L | $619,000 | -- | |
| Beckfield Jason W | $585,000 | -- | |
| Beckfield Jason W | $585,000 | -- |
Source: Public Records
Mortgage History
| Date | Status | Borrower | Loan Amount |
|---|---|---|---|
| Previous Owner | Beckfield Jason W | $446,200 | |
| Previous Owner | Beckfield Jason W | $468,000 |
Source: Public Records
Tax History Compared to Growth
Tax History
| Year | Tax Paid | Tax Assessment Tax Assessment Total Assessment is a certain percentage of the fair market value that is determined by local assessors to be the total taxable value of land and additions on the property. | Land | Improvement |
|---|---|---|---|---|
| 2025 | $8,532 | $1,343,600 | $0 | $1,343,600 |
| 2024 | $7,971 | $1,346,400 | $0 | $1,346,400 |
| 2023 | $7,314 | $1,248,200 | $0 | $1,248,200 |
| 2022 | $7,235 | $1,222,200 | $0 | $1,222,200 |
| 2021 | $7,025 | $1,200,800 | $0 | $1,200,800 |
| 2020 | $6,553 | $1,139,600 | $0 | $1,139,600 |
| 2019 | $6,295 | $1,059,800 | $0 | $1,059,800 |
| 2018 | $6,135 | $975,400 | $0 | $975,400 |
| 2017 | $6,005 | $925,300 | $0 | $925,300 |
| 2016 | $5,917 | $846,500 | $0 | $846,500 |
| 2015 | $5,864 | $749,900 | $0 | $749,900 |
| 2014 | $5,796 | $691,700 | $0 | $691,700 |
Source: Public Records
Map
Nearby Homes
- 2 Hingham St
- 53 Jay St Unit 2
- 515 Franklin St Unit 4
- 1 Jay St
- 950 Massachusetts Ave Unit 418
- 950 Massachusetts Ave Unit 512
- 950 Massachusetts Ave Unit 504
- 950 Massachusetts Ave Unit 417
- 930 Massachusetts Ave
- 931 Massachusetts Ave Unit 1003
- 73 River St Unit 4B
- 15 Trowbridge St Unit 12A
- 11 Dana St Unit D
- 863 Massachusetts Ave Unit 25
- 5 Centre St Unit 32
- 300 Franklin St Unit 5
- 300 Franklin St Unit 1
- 300 Franklin St Unit 2
- 39 Ellery St Unit 6
- 329 Harvard St Unit 1
- 133 Putnam Ave Unit 1
- 133 Putnam Ave Unit 133
- 131 Putnam Ave
- 135 Putnam Ave Unit 137
- 139 Putnam Ave Unit 141
- 30 Elmer St
- 30 Elmer St Unit 34
- 30 Elmer St Unit 16 305
- 30 Elmer St
- 30 Elmer St Unit 16 205
- 30 Elmer St Unit 501
- 30 Elmer St Unit 204
- 30 Elmer St Unit 403
- 30 Elmer St Unit 5-3
- 30 Elmer St Unit 205
- 36 Elmer St
- 32 Elmer St
- 32 Elmer St Unit 32-23
- 32 Elmer St Unit 32
- 32 Elmer St Unit 305