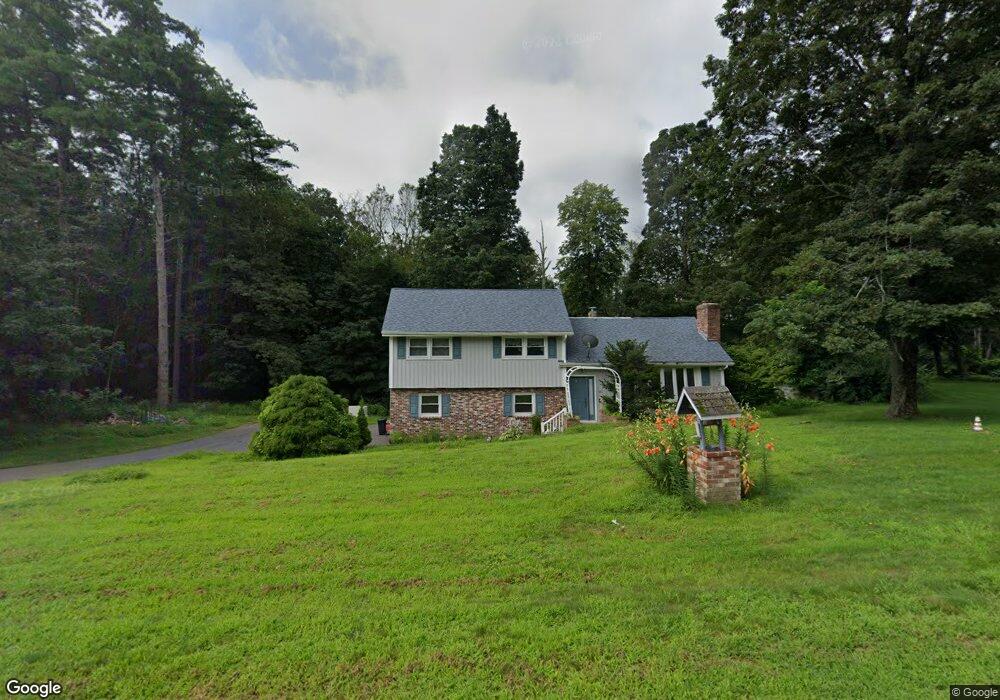
133 Range Rd Windham, NH 03087
Estimated Value: $516,557 - $638,000
2
Beds
2
Baths
1,348
Sq Ft
$432/Sq Ft
Est. Value
About This Home
This home is located at 133 Range Rd, Windham, NH 03087 and is currently estimated at $582,889, approximately $432 per square foot. 133 Range Rd is a home located in Rockingham County with nearby schools including Golden Brook Elementary School, Windham Middle School, and Windham High School.
Ownership History
Date
Name
Owned For
Owner Type
Purchase Details
Closed on
Jan 30, 2026
Sold by
Le Blanc Marion
Bought by
Le Blanc Gary M
Current Estimated Value
Purchase Details
Closed on
Oct 21, 2023
Sold by
Leblanc Marion B
Bought by
Leblanc Marion B and Mckenna Ethel
Home Financials for this Owner
Home Financials are based on the most recent Mortgage that was taken out on this home.
Original Mortgage
$150,000
Interest Rate
7.31%
Mortgage Type
New Conventional
Purchase Details
Closed on
Oct 12, 1977
Bought by
Lachance Arthur R and Lachance Pearl
Create a Home Valuation Report for This Property
The Home Valuation Report is an in-depth analysis detailing your home's value as well as a comparison with similar homes in the area
Home Values in the Area
Average Home Value in this Area
Purchase History
| Date | Buyer | Sale Price | Title Company |
|---|---|---|---|
| Le Blanc Gary M | -- | -- | |
| Leblanc Marion B | -- | None Available | |
| Leblanc Marion B | -- | None Available | |
| Leblanc Marion B | -- | None Available | |
| Lachance Arthur R | -- | -- |
Source: Public Records
Mortgage History
| Date | Status | Borrower | Loan Amount |
|---|---|---|---|
| Previous Owner | Leblanc Marion B | $150,000 |
Source: Public Records
Tax History
| Year | Tax Paid | Tax Assessment Tax Assessment Total Assessment is a certain percentage of the fair market value that is determined by local assessors to be the total taxable value of land and additions on the property. | Land | Improvement |
|---|---|---|---|---|
| 2024 | $7,215 | $318,700 | $149,800 | $168,900 |
| 2023 | $6,820 | $318,700 | $149,800 | $168,900 |
| 2022 | $6,298 | $318,700 | $149,800 | $168,900 |
| 2021 | $5,934 | $318,700 | $149,800 | $168,900 |
| 2020 | $6,097 | $318,700 | $149,800 | $168,900 |
| 2019 | $5,457 | $242,000 | $137,000 | $105,000 |
| 2018 | $5,636 | $242,000 | $137,000 | $105,000 |
| 2017 | $4,888 | $242,000 | $137,000 | $105,000 |
| 2016 | $5,280 | $242,000 | $137,000 | $105,000 |
| 2015 | $5,256 | $242,000 | $137,000 | $105,000 |
| 2014 | $6,415 | $267,300 | $171,000 | $96,300 |
| 2013 | $6,292 | $266,600 | $171,000 | $95,600 |
Source: Public Records
Map
Nearby Homes
Your Personal Tour Guide
Ask me questions while you tour the home.