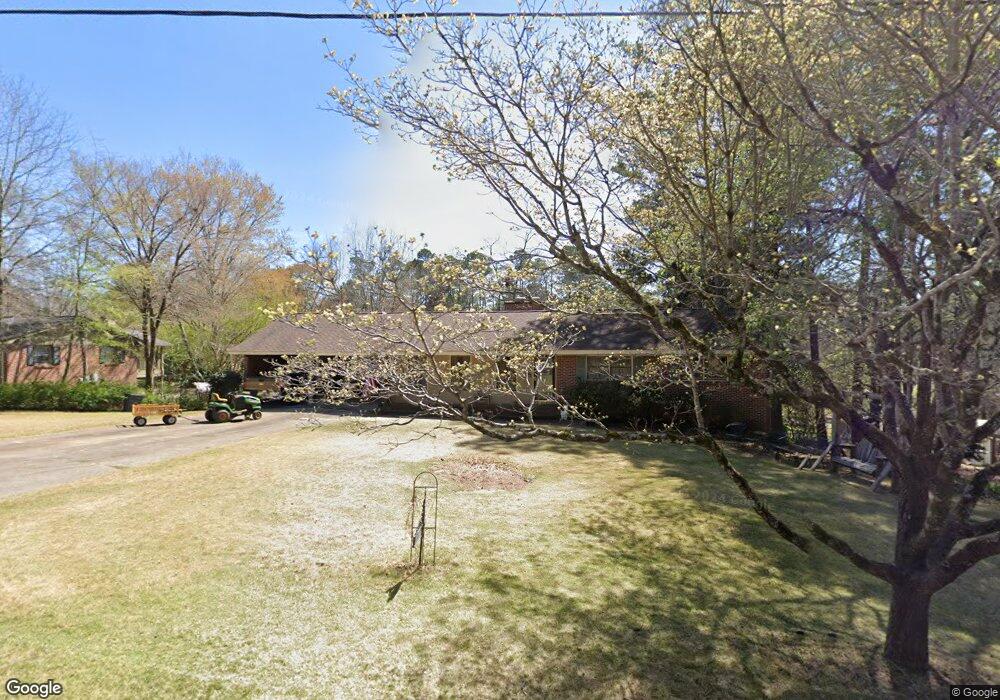
133 S Chilton Crescent Lagrange, GA 30240
Estimated Value: $176,000 - $258,000
3
Beds
3
Baths
1,645
Sq Ft
$134/Sq Ft
Est. Value
About This Home
This home is located at 133 S Chilton Crescent, Lagrange, GA 30240 and is currently estimated at $219,884, approximately $133 per square foot. 133 S Chilton Crescent is a home located in Troup County with nearby schools including Franklin Forest Elementary School, Hollis Hand Elementary School, and Ethel W. Kight Elementary School.
Ownership History
Date
Name
Owned For
Owner Type
Purchase Details
Closed on
Jul 12, 2024
Sold by
Griffin Elaine J
Bought by
Jtc Partners Llc
Current Estimated Value
Purchase Details
Closed on
Jun 24, 1999
Sold by
Elizabeth Edwards
Bought by
Griffin Jerry L and Griffin Elaine J
Purchase Details
Closed on
Jun 23, 1999
Sold by
First Flag Bank
Bought by
Elizabeth Edwards
Purchase Details
Closed on
Jun 22, 1999
Sold by
Suntrust Bank Of West Ga Na
Bought by
First Flag Bank
Purchase Details
Closed on
Jun 21, 1999
Sold by
First Flag Bank
Bought by
Suntrust Bank Of West Ga Na
Purchase Details
Closed on
Nov 22, 1983
Sold by
Culbreth Edward M and Culbreth Mary C
Bought by
First Flag Bank
Purchase Details
Closed on
Feb 1, 1967
Sold by
Smith Porter
Bought by
Culbreth Edward M and Culbreth Mary C
Create a Home Valuation Report for This Property
The Home Valuation Report is an in-depth analysis detailing your home's value as well as a comparison with similar homes in the area
Purchase History
| Date | Buyer | Sale Price | Title Company |
|---|---|---|---|
| Jtc Partners Llc | $160,000 | -- | |
| Griffin Jerry L | $92,000 | -- | |
| Elizabeth Edwards | -- | -- | |
| First Flag Bank | -- | -- | |
| Suntrust Bank Of West Ga Na | -- | -- | |
| First Flag Bank | $62,000 | -- | |
| Culbreth Edward M | -- | -- |
Source: Public Records
Tax History
| Year | Tax Paid | Tax Assessment Tax Assessment Total Assessment is a certain percentage of the fair market value that is determined by local assessors to be the total taxable value of land and additions on the property. | Land | Improvement |
|---|---|---|---|---|
| 2025 | $2,402 | $88,080 | $6,520 | $81,560 |
| 2024 | $2,119 | $79,680 | $6,520 | $73,160 |
| 2023 | $1,628 | $61,680 | $6,520 | $55,160 |
| 2022 | $1,549 | $57,480 | $6,520 | $50,960 |
| 2021 | $1,214 | $42,240 | $6,520 | $35,720 |
| 2020 | $1,214 | $42,240 | $6,520 | $35,720 |
| 2019 | $1,117 | $39,040 | $6,520 | $32,520 |
| 2018 | $1,111 | $38,820 | $6,300 | $32,520 |
| 2017 | $1,111 | $38,820 | $6,300 | $32,520 |
| 2016 | $1,078 | $37,720 | $6,300 | $31,420 |
| 2015 | $1,087 | $37,962 | $6,542 | $31,420 |
| 2014 | $1,039 | $36,309 | $6,542 | $29,767 |
| 2013 | -- | $38,139 | $6,552 | $31,587 |
Source: Public Records
Map
Nearby Homes
- 201 S Chilton Crescent
- 203 S Chilton Crescent
- 732 Camellia Dr
- 724 Camellia Dr
- 106 Ewing St
- 102 Beech Creek Dr
- 204 Dixie Creek Dr
- 204 Colonial St
- 104 Sweetgum Dr
- 110 Russell St
- 900 North St
- 806 New Franklin Rd
- 222 Beechwood Cir
- 114 Briarcliff Rd
- 1784 Mooty Bridge Rd
- 109 Thomas St
- 910 Piney Woods Dr
- 219 Banks St
- 134 S Page St
- 202 Park Hill Dr
- 131 S Chilton Crescent
- 135 S Chilton Crescent
- 145 Marlboro Way
- 125 S Chilton Crescent
- 948 Malibu Dr
- 132 S Chilton Crescent
- 136 S Chilton Crescent
- 946 Malibu Dr
- 138 S Chilton Crescent
- 100 Chesterfield Place
- 128 S Chilton Crescent
- 944 Malibu Dr
- 123 S Chilton Crescent
- 1016 Malibu Dr
- S S Chilton Crescent Unit 6
- S S Chilton Crescent Unit 30/1/2OF31
- S S Chilton Crescent
- 125 N Chilton Crescent
- 127 N Chilton Crescent
- 202 Chesterfield Place
Your Personal Tour Guide
Ask me questions while you tour the home.