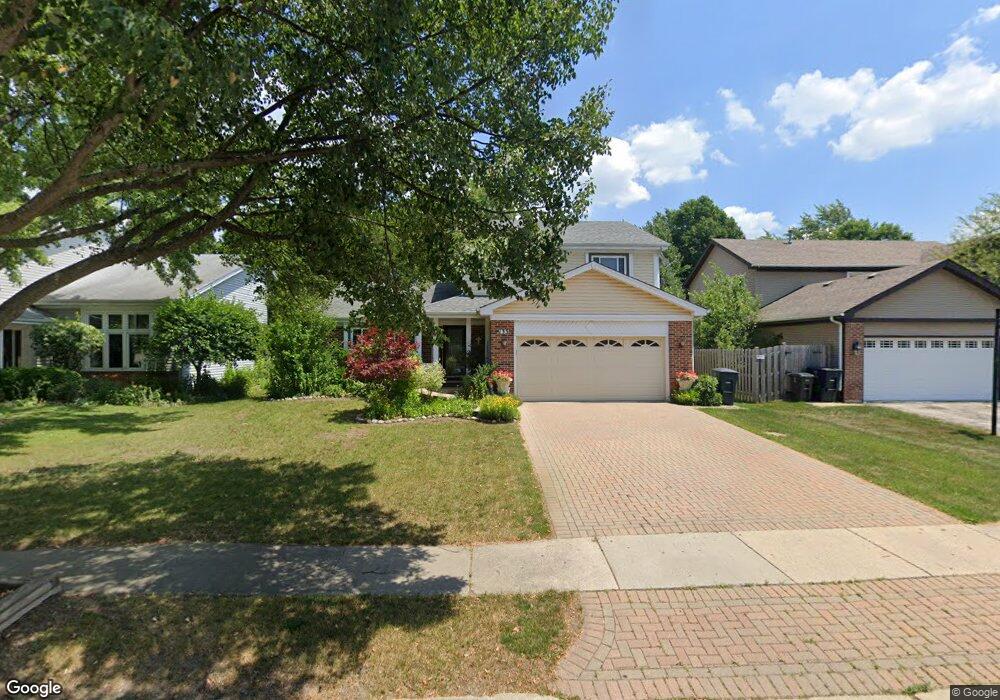
133 S Emerald Ave Mundelein, IL 60060
Estimated Value: $397,712 - $422,000
3
Beds
3
Baths
1,922
Sq Ft
$213/Sq Ft
Est. Value
About This Home
This home is located at 133 S Emerald Ave, Mundelein, IL 60060 and is currently estimated at $409,178, approximately $212 per square foot. 133 S Emerald Ave is a home located in Lake County with nearby schools including Washington Early Learning Center, Mechanics Grove Elementary School, and Carl Sandburg Middle School.
Ownership History
Date
Name
Owned For
Owner Type
Purchase Details
Closed on
Jan 25, 2013
Sold by
Dela Cruz Mercedita E and Dela Cruz Larry F
Bought by
Dela Curz Larry F and Dela Cruz Mercedita E
Current Estimated Value
Purchase Details
Closed on
Jul 2, 2009
Sold by
Dela Cruz Mercedita E and Estoesta Marylin A
Bought by
Dela Cruz Mecedita E
Purchase Details
Closed on
Jun 28, 2005
Sold by
Deguia Hobert T and Deguia Marlita E
Bought by
Estoesta Mercedita A and Estoesta Marylin A
Home Financials for this Owner
Home Financials are based on the most recent Mortgage that was taken out on this home.
Original Mortgage
$240,000
Outstanding Balance
$125,526
Interest Rate
5.69%
Mortgage Type
Fannie Mae Freddie Mac
Estimated Equity
$283,652
Create a Home Valuation Report for This Property
The Home Valuation Report is an in-depth analysis detailing your home's value as well as a comparison with similar homes in the area
Home Values in the Area
Average Home Value in this Area
Purchase History
| Date | Buyer | Sale Price | Title Company |
|---|---|---|---|
| Dela Curz Larry F | -- | Citywide Title Corporation | |
| Dela Cruz Mecedita E | -- | First American Title Ins Co | |
| Estoesta Mercedita A | $300,000 | Ticor |
Source: Public Records
Mortgage History
| Date | Status | Borrower | Loan Amount |
|---|---|---|---|
| Open | Estoesta Mercedita A | $240,000 |
Source: Public Records
Tax History Compared to Growth
Tax History
| Year | Tax Paid | Tax Assessment Tax Assessment Total Assessment is a certain percentage of the fair market value that is determined by local assessors to be the total taxable value of land and additions on the property. | Land | Improvement |
|---|---|---|---|---|
| 2024 | $8,870 | $107,877 | $15,796 | $92,081 |
| 2023 | $8,062 | $91,521 | $13,401 | $78,120 |
| 2022 | $8,062 | $80,944 | $16,010 | $64,934 |
| 2021 | $7,708 | $78,108 | $15,449 | $62,659 |
| 2020 | $7,579 | $75,959 | $15,024 | $60,935 |
| 2019 | $7,334 | $73,461 | $14,530 | $58,931 |
| 2018 | $8,147 | $80,896 | $16,780 | $64,116 |
| 2017 | $8,043 | $78,350 | $16,252 | $62,098 |
| 2016 | $7,832 | $74,413 | $15,435 | $58,978 |
| 2015 | $7,633 | $69,760 | $14,470 | $55,290 |
| 2014 | $7,604 | $70,679 | $13,920 | $56,759 |
| 2012 | $8,111 | $71,307 | $14,044 | $57,263 |
Source: Public Records
Map
Nearby Homes
- 116 S Pershing Ave
- 26980 N Pierre Dr
- 207 N Idlewild Ave
- 29746 U S 45
- 26892 N Iride Dr
- 250 N Fairlawn Ave
- 19925 W Il Route 60
- 1297 Spalding Dr
- 1305 Spalding Dr
- 19738 W Martin Dr
- 201 Bingham Cir
- 26220 N Midlothian Rd
- 26642 N Il Route 83
- 208 Bingham Cir
- 331 Plaza Cir
- 547 N Ridgemoor Ave
- 123 Dunton Ct
- 19330 W Lake View Ave
- 619 N California Ave Unit 1
- 1360 Edington Ln
- 127 S Emerald Ave
- 139 S Emerald Ave
- 145 S Emerald Ave
- 121 S Emerald Ave
- 134 S Greenview Ave
- 128 S Greenview Ave
- 140 S Greenview Ave
- 115 S Emerald Ave
- 122 S Greenview Ave
- 146 S Greenview Ave
- 128 S Emerald Ave
- 140 S Emerald Ave
- 122 S Emerald Ave
- 442 Quigley St
- 436 Quigley St
- 116 S Greenview Ave
- 146 S Emerald Ave
- 116 S Emerald Ave
- 109 S Emerald Ave
- 430 Quigley St