J
Landlord's Agent in 2017
Jinjin Lin
Pacific Village Realty
Estimated Value: $857,923 - $1,249,000
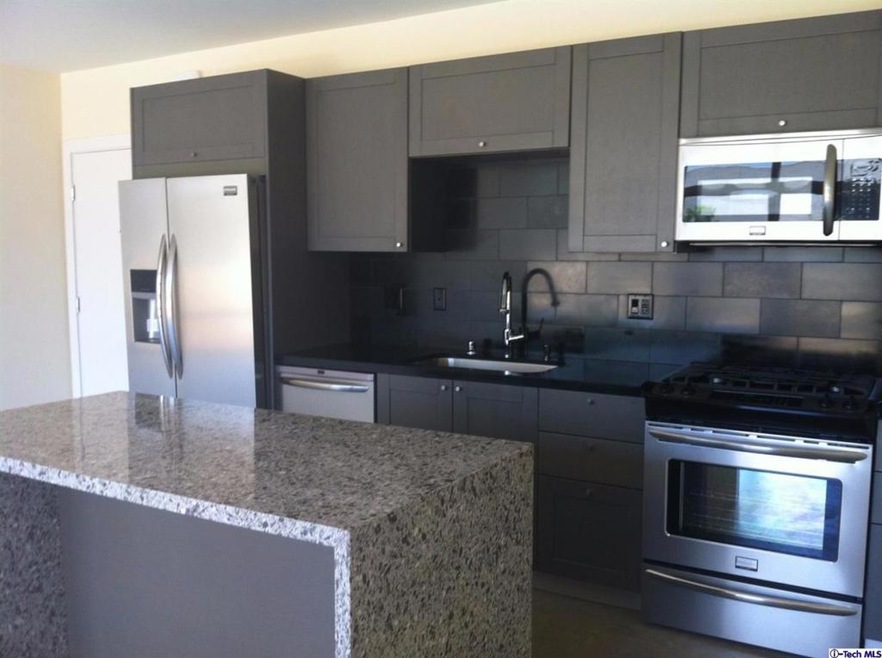
Welcome to Burton. Located near Old Town. This unit features a spacious open kitchen, stackable washer / dryer, polished concrete floors and full granite backsplash and countertops. Additional features include Cat 6 wiring throughout, walk in closets,Frigidaire gallery appliances, Italian custom cabinetry, center island. Steps away from the pulse of Pasadena. From neighborhood boutiques and fine dining, to a variety of entertainment options, The Burton is Pasadena's exclusive address for sophisticated living.
Last Agent to Rent the Property
Jinjin Lin
Pacific Village Realty License #01924467 Listed on: 05/27/2017
Last Renter's Agent
Jinjin Lin
Pacific Village Realty License #01924467 Listed on: 05/27/2017
| Date | Buyer | Sale Price | Title Company |
|---|---|---|---|
| Chen Tzu Bin | $699,000 | Chicago Title Company |
| Date | Event | Price | List to Sale | Price per Sq Ft | Prior Sale |
|---|---|---|---|---|---|
| 05/27/2017 05/27/17 | Rented | $3,100 | -3.1% | -- | |
| 05/27/2017 05/27/17 | For Rent | $3,200 | +6.7% | -- | |
| 08/15/2014 08/15/14 | Rented | $3,000 | -6.3% | -- | |
| 07/16/2014 07/16/14 | Under Contract | -- | -- | -- | |
| 07/04/2014 07/04/14 | For Rent | $3,200 | 0.0% | -- | |
| 06/20/2014 06/20/14 | Sold | $699,000 | 0.0% | $634 / Sq Ft | View Prior Sale |
| 06/20/2014 06/20/14 | Pending | -- | -- | -- | |
| 05/05/2014 05/05/14 | For Sale | $699,000 | -- | $634 / Sq Ft |
| Year | Tax Paid | Tax Assessment Tax Assessment Total Assessment is a certain percentage of the fair market value that is determined by local assessors to be the total taxable value of land and additions on the property. | Land | Improvement |
|---|---|---|---|---|
| 2025 | $9,491 | $856,867 | $599,442 | $257,425 |
| 2024 | $9,491 | $840,067 | $587,689 | $252,378 |
| 2023 | $9,410 | $823,596 | $576,166 | $247,430 |
| 2022 | $9,080 | $807,448 | $564,869 | $242,579 |
| 2021 | $8,709 | $791,617 | $553,794 | $237,823 |
| 2020 | $8,353 | $783,501 | $548,116 | $235,385 |
| 2019 | $8,377 | $768,139 | $537,369 | $230,770 |
| 2018 | $8,583 | $753,079 | $526,833 | $226,246 |
| 2016 | $8,315 | $723,837 | $506,376 | $217,461 |
| 2015 | $8,881 | $712,965 | $498,770 | $214,195 |
| 2014 | $2,777 | $232,249 | $41,286 | $190,963 |
J
Landlord's Agent in 2017
Jinjin Lin
Pacific Village Realty

Seller's Agent in 2014
Jayne Parsons
Keller Williams Realty
(626) 233-6428
1 in this area
64 Total Sales
Seller Co-Listing Agent in 2014
Brian Parsons
Keller Williams Realty
(626) 340-8050
1 in this area
123 Total Sales
P
Buyer's Agent in 2014
Powai Wong
Coldwell Banker
Source: Pasadena-Foothills Association of REALTORS®
MLS Number: P0-317004779
APN: 5722-030-084
Disclaimer: Certain information contained herein is derived from information provided by parties other than Homes.com. All information provided is deemed reliable, but is not guaranteed to be accurate and should be independently verified.
![]() IDX information is provided exclusively for personal, non-commercial use, and may not be used for any purpose other than to identify prospective properties consumers may be interested in purchasing. Information is deemed reliable but not guaranteed.
IDX information is provided exclusively for personal, non-commercial use, and may not be used for any purpose other than to identify prospective properties consumers may be interested in purchasing. Information is deemed reliable but not guaranteed.
Ask me questions while you tour the home.