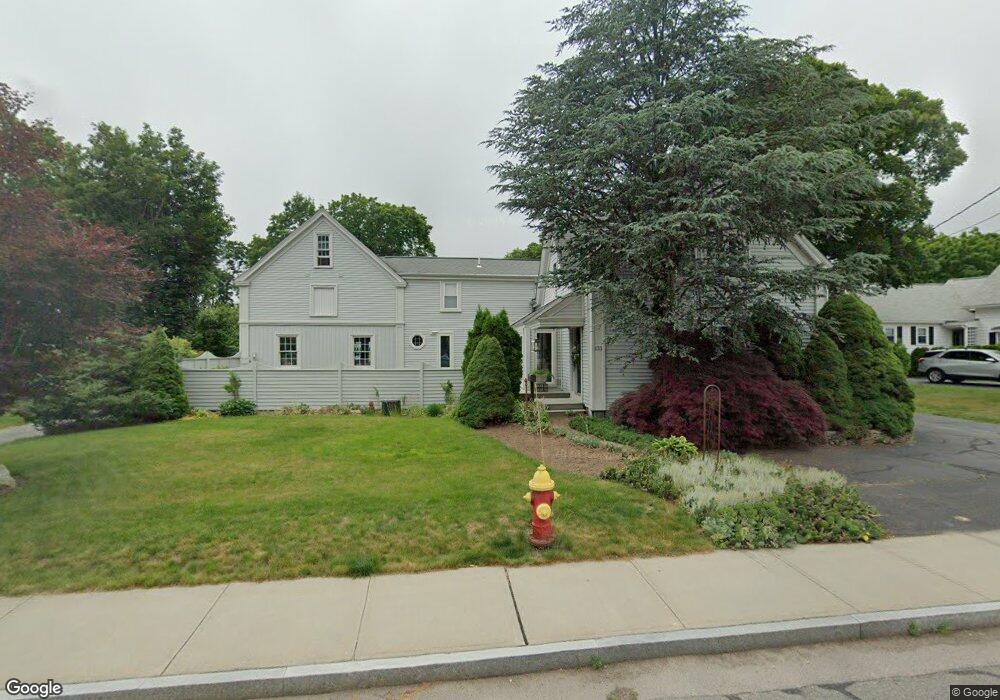
133 S Main St Mansfield, MA 02048
Estimated Value: $700,000 - $747,000
3
Beds
3
Baths
2,054
Sq Ft
$354/Sq Ft
Est. Value
About This Home
This home is located at 133 S Main St, Mansfield, MA 02048 and is currently estimated at $727,314, approximately $354 per square foot. 133 S Main St is a home located in Bristol County with nearby schools including Everett W. Robinson Elementary School, Jordan/Jackson Elementary School, and Harold L. Qualters Middle School.
Ownership History
Date
Name
Owned For
Owner Type
Purchase Details
Closed on
Jun 1, 1994
Sold by
Cauldwell Alexander B and Cauldwell Joyce R
Bought by
Bakuzonis Lynne N and Bakuzonis Christine B
Current Estimated Value
Home Financials for this Owner
Home Financials are based on the most recent Mortgage that was taken out on this home.
Original Mortgage
$100,000
Interest Rate
8.49%
Mortgage Type
Purchase Money Mortgage
Create a Home Valuation Report for This Property
The Home Valuation Report is an in-depth analysis detailing your home's value as well as a comparison with similar homes in the area
Home Values in the Area
Average Home Value in this Area
Purchase History
| Date | Buyer | Sale Price | Title Company |
|---|---|---|---|
| Bakuzonis Lynne N | $174,900 | -- |
Source: Public Records
Mortgage History
| Date | Status | Borrower | Loan Amount |
|---|---|---|---|
| Closed | Bakuzonis Lynne N | $100,000 | |
| Previous Owner | Bakuzonis Lynne N | $15,000 |
Source: Public Records
Tax History Compared to Growth
Tax History
| Year | Tax Paid | Tax Assessment Tax Assessment Total Assessment is a certain percentage of the fair market value that is determined by local assessors to be the total taxable value of land and additions on the property. | Land | Improvement |
|---|---|---|---|---|
| 2025 | $8,683 | $659,300 | $241,800 | $417,500 |
| 2024 | $8,733 | $646,900 | $241,800 | $405,100 |
| 2023 | $8,381 | $594,800 | $241,800 | $353,000 |
| 2022 | $8,254 | $544,100 | $223,800 | $320,300 |
| 2021 | $7,725 | $502,900 | $195,900 | $307,000 |
| 2020 | $6,996 | $455,500 | $186,600 | $268,900 |
| 2019 | $6,960 | $457,300 | $155,400 | $301,900 |
| 2018 | $4,073 | $437,400 | $148,200 | $289,200 |
| 2017 | $6,430 | $428,100 | $144,000 | $284,100 |
| 2016 | $6,061 | $393,300 | $137,100 | $256,200 |
| 2015 | $5,780 | $372,900 | $137,100 | $235,800 |
Source: Public Records
Map
Nearby Homes
- 28 Court St
- 150 Rumford Ave Unit 110
- 22 Pleasant St Unit C
- 82 Brook St
- 166 Chauncy St
- 442 Ware St
- 460 Ware St
- 277 Central St
- 571 Ware St
- 28 Angell St
- 44 Angell St Unit 44
- 619 N Main St
- 631 East St Unit E203
- 356 Central St
- 18 Columbine Rd
- 15 Reservoir St Unit 44
- 12 Spring St
- 212 Mill St
- 6 Erick Rd Unit 73
- 15 Rock Ln