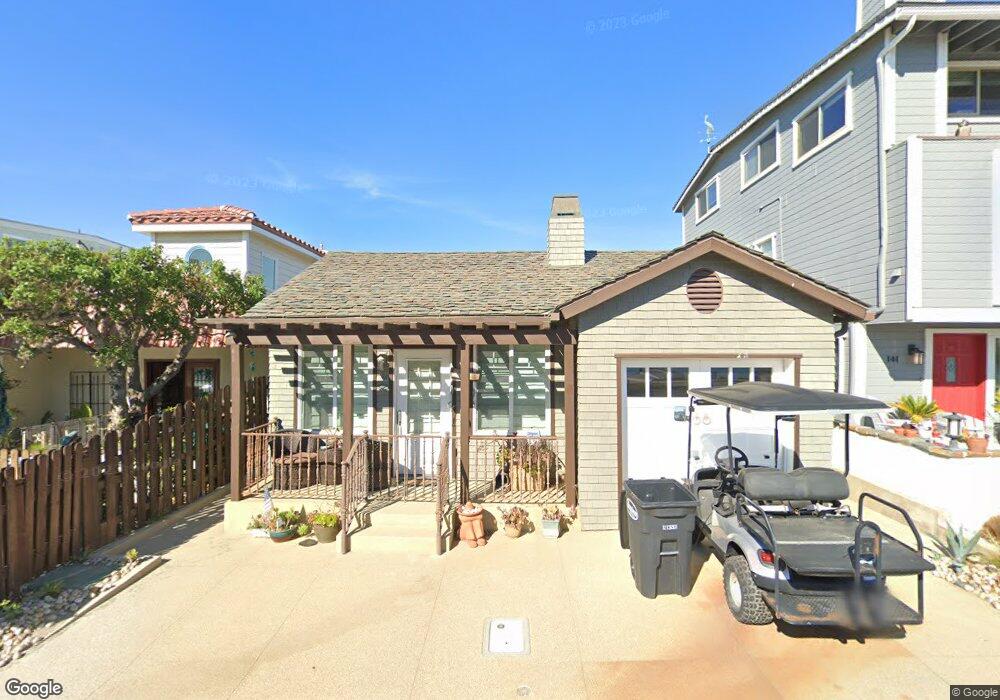
133 San Clemente Ave Oxnard, CA 93035
Hollywood Beach NeighborhoodEstimated Value: $1,185,272 - $1,614,000
2
Beds
2
Baths
806
Sq Ft
$1,784/Sq Ft
Est. Value
About This Home
This home is located at 133 San Clemente Ave, Oxnard, CA 93035 and is currently estimated at $1,437,568, approximately $1,783 per square foot. 133 San Clemente Ave is a home located in Ventura County with nearby schools including Hollywood Beach Elementary School, Oxnard High School, and St. Anthony's Elementary School.
Ownership History
Date
Name
Owned For
Owner Type
Purchase Details
Closed on
Jan 13, 2015
Sold by
Folger Martin and Folger Kathleen
Bought by
Fogler Martin
Current Estimated Value
Purchase Details
Closed on
Jan 28, 2010
Sold by
Folger Martin and Folger Kathleen
Bought by
Folger Martin and Folger Kathleen
Home Financials for this Owner
Home Financials are based on the most recent Mortgage that was taken out on this home.
Original Mortgage
$598,290
Interest Rate
5.25%
Mortgage Type
FHA
Purchase Details
Closed on
Oct 30, 2008
Sold by
The Gary Troy Foundation
Bought by
Folger Martin and Folger Kathleen
Home Financials for this Owner
Home Financials are based on the most recent Mortgage that was taken out on this home.
Original Mortgage
$400,000
Interest Rate
6.04%
Mortgage Type
Seller Take Back
Purchase Details
Closed on
Dec 19, 1998
Sold by
Troy Gary 1991 Trust and Steven D
Bought by
The Gary Troy Foundation
Purchase Details
Closed on
Sep 19, 1994
Sold by
Troy Gary
Bought by
Troy Gary
Create a Home Valuation Report for This Property
The Home Valuation Report is an in-depth analysis detailing your home's value as well as a comparison with similar homes in the area
Home Values in the Area
Average Home Value in this Area
Purchase History
| Date | Buyer | Sale Price | Title Company |
|---|---|---|---|
| Fogler Martin | -- | Accommodation | |
| Folger Martin | -- | Accommodation | |
| Folger Martin | -- | Lawyers Title | |
| Folger Martin | $500,000 | California Title Company | |
| The Gary Troy Foundation | -- | -- | |
| Troy Gary | -- | -- |
Source: Public Records
Mortgage History
| Date | Status | Borrower | Loan Amount |
|---|---|---|---|
| Previous Owner | Folger Martin | $598,290 | |
| Previous Owner | Folger Martin | $400,000 |
Source: Public Records
Tax History
| Year | Tax Paid | Tax Assessment Tax Assessment Total Assessment is a certain percentage of the fair market value that is determined by local assessors to be the total taxable value of land and additions on the property. | Land | Improvement |
|---|---|---|---|---|
| 2025 | $7,873 | $670,712 | $547,290 | $123,422 |
| 2024 | $7,873 | $657,561 | $536,559 | $121,002 |
| 2023 | $7,478 | $644,668 | $526,038 | $118,630 |
| 2022 | $7,269 | $632,028 | $515,724 | $116,304 |
| 2021 | $7,266 | $619,636 | $505,612 | $114,024 |
| 2020 | $7,180 | $613,284 | $500,429 | $112,855 |
| 2019 | $7,079 | $601,260 | $490,617 | $110,643 |
| 2018 | $6,842 | $589,472 | $480,998 | $108,474 |
| 2017 | $6,590 | $577,915 | $471,567 | $106,348 |
| 2016 | $6,391 | $566,584 | $462,321 | $104,263 |
| 2015 | $6,234 | $558,076 | $455,378 | $102,698 |
| 2014 | $6,168 | $547,146 | $446,458 | $100,688 |
Source: Public Records
Map
Nearby Homes
- 3124 Ocean Dr
- 3237 Playa Ct
- 3300 Ocean Dr
- 3301 3305 Ocean
- 3350 Ocean Dr
- 274 Sunset
- 2916 Lakeshore Ct
- 3365 Ocean Dr
- 2525 Roosevelt Blvd
- 2516 Roosevelt Blvd
- 3405 Ocean Dr
- 2421 Ocean Dr
- 2408 Ocean Dr
- 105 Malibu Ave
- 2825 Panama Dr
- 3445 Ocean Dr
- 2125 Piru Ave
- 333 Melrose Dr
- 316 Santa Monica Dr
- 345 Melrose Dr
- 129 San Clemente Ave
- 140 Santa Ana Ave
- 132 Santa Ana Ave
- 145 San Clemente 1weup75yaluw
- 145 San Clemente Ave
- 128 Santa Ana Ave
- 125 San Clemente Ave
- 3208 Playa Ct
- 132 San Clemente Ave
- 3216 Playa Ct
- 128 San Clemente Ave
- 3224 Playa Ct
- 120 San Clemente Ave
- 3226 Playa Ct
- 116 San Clemente Ave
- 129 Santa Cruz Ave
- 125 Santa Cruz Ave
- 3201 Playa Ct
- 3217 Playa Ct
- 114 San Clemente Ave
Your Personal Tour Guide
Ask me questions while you tour the home.