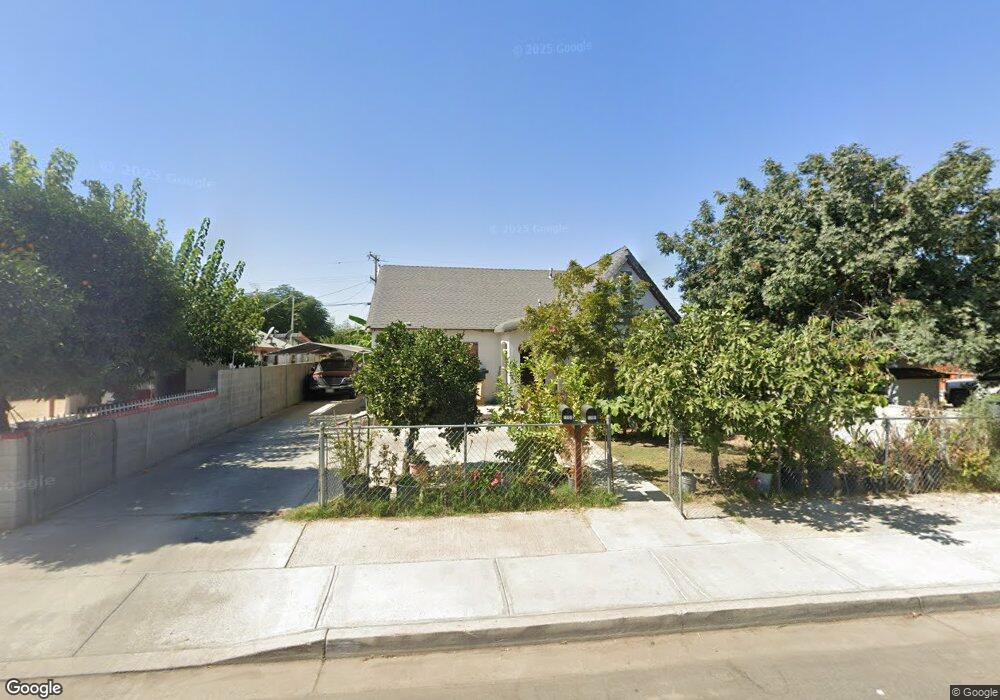
133 San Lucas St Mc Farland, CA 93250
Estimated Value: $242,225 - $259,000
2
Beds
1
Bath
1,358
Sq Ft
$186/Sq Ft
Est. Value
About This Home
This home is located at 133 San Lucas St, Mc Farland, CA 93250 and is currently estimated at $252,056, approximately $185 per square foot. 133 San Lucas St is a home located in Kern County with nearby schools including McFarland High School.
Ownership History
Date
Name
Owned For
Owner Type
Purchase Details
Closed on
Jun 3, 2016
Sold by
Melcher German Davalos
Bought by
Davalos Miguel
Current Estimated Value
Purchase Details
Closed on
Jan 10, 2011
Sold by
Castaneda Abraham Mendez
Bought by
Melchor German Davalos
Purchase Details
Closed on
Jan 15, 2004
Sold by
Mendez Ofelia
Bought by
Castaneda Abraham Mendez
Purchase Details
Closed on
Sep 6, 2002
Sold by
Aguilar Federico and Aguilar Boudelia
Bought by
Castaneda Mendez Ofelia and Castaneda Mendez Abrahan
Purchase Details
Closed on
Dec 15, 1995
Sold by
Olguin Juan and Olguin Michael
Bought by
Aguilar Federico and Aguilar Baudelia
Home Financials for this Owner
Home Financials are based on the most recent Mortgage that was taken out on this home.
Original Mortgage
$51,344
Interest Rate
7.37%
Mortgage Type
Seller Take Back
Create a Home Valuation Report for This Property
The Home Valuation Report is an in-depth analysis detailing your home's value as well as a comparison with similar homes in the area
Home Values in the Area
Average Home Value in this Area
Purchase History
| Date | Buyer | Sale Price | Title Company |
|---|---|---|---|
| Davalos Miguel | -- | None Available | |
| Melchor German Davalos | -- | None Available | |
| Castaneda Abraham Mendez | -- | -- | |
| Castaneda Mendez Ofelia | -- | -- | |
| Aguilar Federico | $56,000 | Chicago Title Co |
Source: Public Records
Mortgage History
| Date | Status | Borrower | Loan Amount |
|---|---|---|---|
| Previous Owner | Aguilar Federico | $51,344 |
Source: Public Records
Tax History Compared to Growth
Tax History
| Year | Tax Paid | Tax Assessment Tax Assessment Total Assessment is a certain percentage of the fair market value that is determined by local assessors to be the total taxable value of land and additions on the property. | Land | Improvement |
|---|---|---|---|---|
| 2025 | $180 | $179,952 | $29,591 | $150,361 |
| 2024 | $1,436 | $110,248 | $29,011 | $81,237 |
| 2023 | $1,436 | $108,088 | $28,443 | $79,645 |
| 2022 | $1,400 | $105,970 | $27,886 | $78,084 |
| 2021 | $1,331 | $103,893 | $27,340 | $76,553 |
| 2020 | $1,285 | $102,829 | $27,060 | $75,769 |
| 2019 | $1,213 | $102,829 | $27,060 | $75,769 |
| 2018 | $1,198 | $98,838 | $26,010 | $72,828 |
| 2017 | $1,169 | $96,900 | $25,500 | $71,400 |
| 2016 | $741 | $58,438 | $16,232 | $42,206 |
| 2015 | $729 | $57,562 | $15,989 | $41,573 |
| 2014 | $700 | $56,435 | $15,676 | $40,759 |
Source: Public Records
Map
Nearby Homes
- 148 San Lucas St
- 0 E Sherwood Ave
- 254 E Sherwood Ave
- 276 San Juan St
- 389 Mount Arbor St
- 249 Robertson Ave
- 124 4th Place
- 0 W Sherwood Ave Unit 202506495
- 0 W Sherwood Ave Unit 21453658
- 805 Price St
- 836 Fletcher St
- 852 Butte St
- 830 Davis Ave
- 314 8th St
- 450 8th St
- 583 Taylor Ave
- 1085 Mast Ave
- 737 Misty Ave
- 733 Ensenata Dr
- 1043 Moscato St
- 125 San Lucas St
- 141 San Lucas St
- 117 San Lucas St
- 149 San Lucas St
- 109 San Lucas St
- 157 San Lucas St
- 140 Browning Rd
- 132 Browning Rd
- 156 Browning Rd
- 131 San Lucas St Unit 2
- 124 Browning Rd
- 165 San Lucas St Unit 1 & 2
- 165 San Lucas St
- 124 San Lucas St
- 140 San Lucas St
- 116 San Lucas St
- 101 San Lucas St
- 164 Browning Rd
- 116 Browning Rd
- 108 San Lucas St