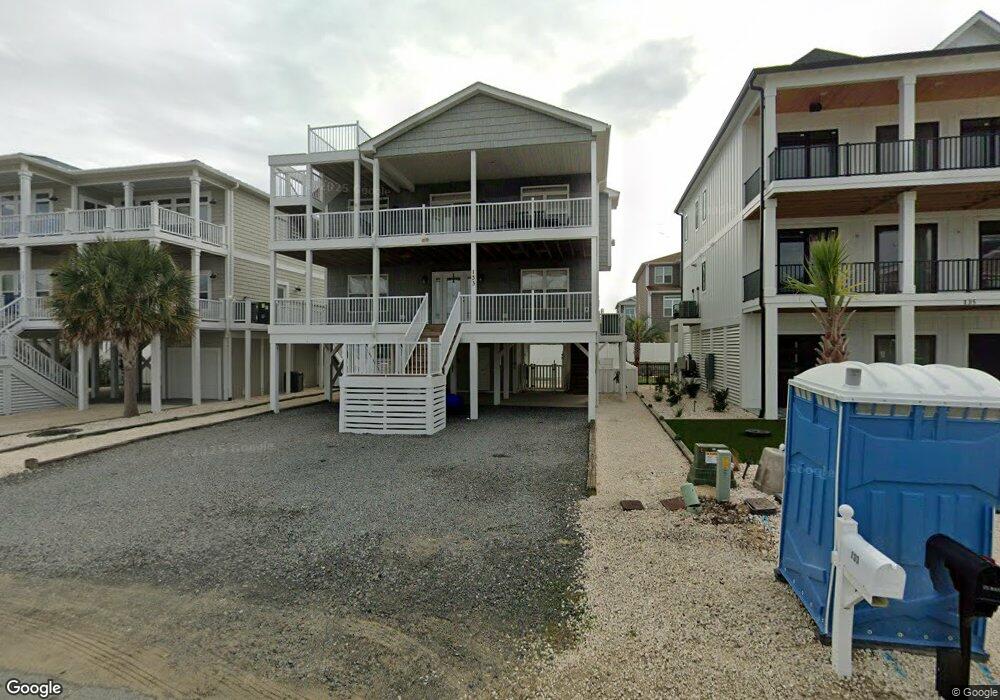
133 W 3rd St Ocean Isle Beach, NC 28469
Estimated Value: $1,060,000 - $1,320,000
4
Beds
4
Baths
2,201
Sq Ft
$542/Sq Ft
Est. Value
About This Home
This home is located at 133 W 3rd St, Ocean Isle Beach, NC 28469 and is currently estimated at $1,192,548, approximately $541 per square foot. 133 W 3rd St is a home located in Brunswick County with nearby schools including Union Elementary School, Shallotte Middle School, and West Brunswick High School.
Ownership History
Date
Name
Owned For
Owner Type
Purchase Details
Closed on
Nov 19, 2018
Sold by
Mcateer Jeremy David and Mcateer Amber Lynn
Bought by
Lamoureaux Marc A and Lamoureaux Lori D
Current Estimated Value
Home Financials for this Owner
Home Financials are based on the most recent Mortgage that was taken out on this home.
Original Mortgage
$453,000
Outstanding Balance
$399,128
Interest Rate
4.9%
Mortgage Type
New Conventional
Estimated Equity
$793,420
Purchase Details
Closed on
Aug 4, 2016
Sold by
Newberry David Brian and Strother Sharon E
Bought by
Mcateer Jeremy David and Mcateer Amber Lynn
Home Financials for this Owner
Home Financials are based on the most recent Mortgage that was taken out on this home.
Original Mortgage
$348,000
Interest Rate
3.56%
Mortgage Type
New Conventional
Purchase Details
Closed on
Oct 11, 2006
Sold by
Myers James B and Myers Cherry
Bought by
Jessie & Myers Construction Company Inc
Create a Home Valuation Report for This Property
The Home Valuation Report is an in-depth analysis detailing your home's value as well as a comparison with similar homes in the area
Home Values in the Area
Average Home Value in this Area
Purchase History
| Date | Buyer | Sale Price | Title Company |
|---|---|---|---|
| Lamoureaux Marc A | $575,000 | None Available | |
| Mcateer Jeremy David | $435,000 | None Available | |
| Jessie & Myers Construction Company Inc | -- | None Available |
Source: Public Records
Mortgage History
| Date | Status | Borrower | Loan Amount |
|---|---|---|---|
| Open | Lamoureaux Marc A | $453,000 | |
| Previous Owner | Mcateer Jeremy David | $348,000 |
Source: Public Records
Tax History Compared to Growth
Tax History
| Year | Tax Paid | Tax Assessment Tax Assessment Total Assessment is a certain percentage of the fair market value that is determined by local assessors to be the total taxable value of land and additions on the property. | Land | Improvement |
|---|---|---|---|---|
| 2025 | $3,759 | $982,030 | $400,000 | $582,030 |
| 2024 | $3,759 | $982,030 | $400,000 | $582,030 |
| 2023 | $2,985 | $982,030 | $400,000 | $582,030 |
| 2022 | $2,985 | $532,900 | $180,000 | $352,900 |
| 2021 | $2,893 | $514,060 | $180,000 | $334,060 |
| 2020 | $2,858 | $514,060 | $180,000 | $334,060 |
| 2019 | $2,831 | $180,000 | $180,000 | $0 |
| 2018 | $2,431 | $431,670 | $120,000 | $311,670 |
| 2017 | $2,344 | $120,000 | $120,000 | $0 |
| 2016 | $2,377 | $120,000 | $120,000 | $0 |
| 2015 | $2,369 | $431,670 | $120,000 | $311,670 |
| 2014 | $2,334 | $471,260 | $250,000 | $221,260 |
Source: Public Records
Map
Nearby Homes
- 97 W 2nd St
- 100 W 1st St Unit 5
- 304 W 2nd St
- 14 Private Dr
- 43 Private Dr
- 74 Private Dr
- 12 Causeway Dr Unit 310
- 196 W Fourth St
- 3 Gatha Dr
- 28 E First St Unit 3C
- 317 W 1st St
- 2 Monroe St
- 240 W Second St Unit 7C
- 250 W Second St Unit 2B
- 253 W Second St
- 98 Laurinburg St
- 36 Fairmont St
- 66 E 2nd St
- 269 W Second St Unit 15g
- 51 Wilmington St
- 133 W Third St
- 135 W 3rd St
- 129 W Third St
- 134 W Third St
- 74 W 2nd St
- 70 W Second St
- 76 W Second St
- 127 W Third
- 130 W 3rd St
- 78 W 2nd St
- 128 W Third St
- 0 Lot 67 the Resort Unit 20635791
- 153 W Third St SW
- 155 W Third St SW
- 157 W Third St SW
- 155 W Third St
- 17 W Fourth St
- 15 W Fourth St
- 25 W Fourth St
- 138 W 3rd St