Estimated Value: $163,000 - $265,440
--
Bed
--
Bath
--
Sq Ft
0.36
Acres
About This Home
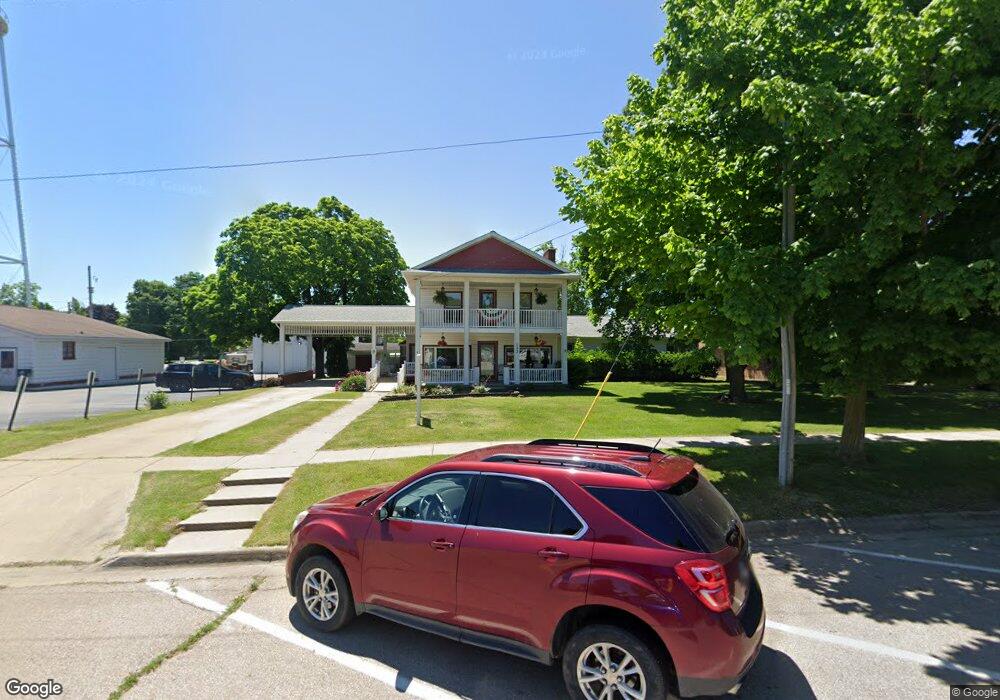
This home is located at 133 W Main St, Elsie, MI 48831 and is currently estimated at $224,860. 133 W Main St is a home located in Clinton County with nearby schools including E.E. Knight Elementary School, Leonard Elementary School, and Ovid-Elsie Middle School.
Ownership History
Date
Name
Owned For
Owner Type
Purchase Details
Closed on
Jun 1, 2018
Sold by
Welcome Home Of Elsie Llc
Bought by
Karen S Laseck Llc
Current Estimated Value
Home Financials for this Owner
Home Financials are based on the most recent Mortgage that was taken out on this home.
Original Mortgage
$390,000
Outstanding Balance
$336,522
Interest Rate
4.4%
Mortgage Type
Commercial
Estimated Equity
-$111,662
Purchase Details
Closed on
Nov 10, 2005
Sold by
Bowen Kimberly M
Bought by
Welcome Home Of Elsie Llc
Home Financials for this Owner
Home Financials are based on the most recent Mortgage that was taken out on this home.
Original Mortgage
$282,700
Interest Rate
6.2%
Mortgage Type
Unknown
Purchase Details
Closed on
Nov 9, 2005
Sold by
Grubaugh Daniel and Grubaugh Sandy
Bought by
Bowen Kimberly M
Home Financials for this Owner
Home Financials are based on the most recent Mortgage that was taken out on this home.
Original Mortgage
$282,700
Interest Rate
6.2%
Mortgage Type
Unknown
Create a Home Valuation Report for This Property
The Home Valuation Report is an in-depth analysis detailing your home's value as well as a comparison with similar homes in the area
Home Values in the Area
Average Home Value in this Area
Purchase History
| Date | Buyer | Sale Price | Title Company |
|---|---|---|---|
| Karen S Laseck Llc | $275,000 | Ata National Title Group | |
| Welcome Home Of Elsie Llc | -- | None Available | |
| Bowen Kimberly M | $245,000 | Metropolitan Title Company |
Source: Public Records
Mortgage History
| Date | Status | Borrower | Loan Amount |
|---|---|---|---|
| Open | Karen S Laseck Llc | $390,000 | |
| Previous Owner | Bowen Kimberly M | $282,700 |
Source: Public Records
Tax History Compared to Growth
Tax History
| Year | Tax Paid | Tax Assessment Tax Assessment Total Assessment is a certain percentage of the fair market value that is determined by local assessors to be the total taxable value of land and additions on the property. | Land | Improvement |
|---|---|---|---|---|
| 2025 | $3,485 | $160,400 | $5,800 | $154,600 |
| 2024 | $840 | $181,700 | $5,800 | $175,900 |
| 2023 | $796 | $178,200 | $0 | $0 |
| 2022 | $3,124 | $143,300 | $11,900 | $131,400 |
| 2021 | $3,171 | $91,800 | $11,000 | $80,800 |
| 2020 | $3,842 | $92,000 | $5,300 | $86,700 |
| 2019 | $2,792 | $60,000 | $0 | $0 |
| 2018 | $1,857 | $66,000 | $5,300 | $60,700 |
| 2017 | -- | $70,800 | $5,100 | $65,700 |
| 2016 | $1,789 | $75,900 | $5,100 | $70,800 |
| 2015 | -- | $60,800 | $0 | $0 |
| 2011 | -- | $65,000 | $0 | $0 |
Source: Public Records
Map
Nearby Homes
- 229 W Maple St
- 204 W Pine St
- 228 E Pine St
- 323 E Main St
- 7060 E Maple Rapids Rd
- 4321 N Upton Rd
- 000 W Huff Rd
- 5752 E Colony Rd
- 0 E Colony Rd Unit 286182
- 11550 S Wisner Rd
- 218 W High St
- 228 W Pearl St
- 306 N Main St
- 222 N Main St
- 210 W Front St
- 217 W Clinton St
- 10230 E Cleveland Rd
- 6687 Winfield Rd
- 1 Peet Rd
- 9882 W M 21