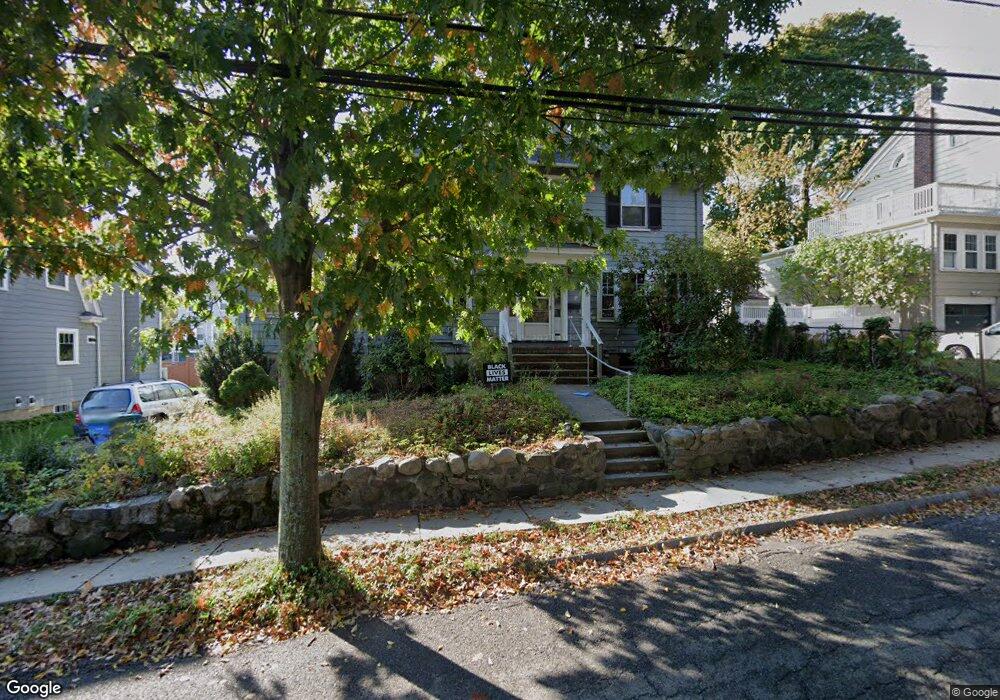
133 Washington St Belmont, MA 02478
Cushing Square NeighborhoodEstimated Value: $1,150,000 - $1,514,000
4
Beds
2
Baths
1,871
Sq Ft
$722/Sq Ft
Est. Value
About This Home
This home is located at 133 Washington St, Belmont, MA 02478 and is currently estimated at $1,350,224, approximately $721 per square foot. 133 Washington St is a home located in Middlesex County with nearby schools including Winthrop L Chenery Middle School, Mary Lee Burbank Elementary School, and Belmont High School.
Ownership History
Date
Name
Owned For
Owner Type
Purchase Details
Closed on
Nov 16, 2001
Sold by
Devore Irven and Devore Nancy S
Bought by
Weick Kevin D and Devore Marie C
Current Estimated Value
Home Financials for this Owner
Home Financials are based on the most recent Mortgage that was taken out on this home.
Original Mortgage
$275,000
Outstanding Balance
$107,325
Interest Rate
6.7%
Mortgage Type
Purchase Money Mortgage
Estimated Equity
$1,242,899
Purchase Details
Closed on
Jul 27, 1998
Sold by
Hartnett Harry D
Bought by
Devore Irven and Devore Nancy S
Home Financials for this Owner
Home Financials are based on the most recent Mortgage that was taken out on this home.
Original Mortgage
$314,360
Interest Rate
6.99%
Mortgage Type
Purchase Money Mortgage
Create a Home Valuation Report for This Property
The Home Valuation Report is an in-depth analysis detailing your home's value as well as a comparison with similar homes in the area
Home Values in the Area
Average Home Value in this Area
Purchase History
| Date | Buyer | Sale Price | Title Company |
|---|---|---|---|
| Weick Kevin D | $382,000 | -- | |
| Devore Irven | $392,950 | -- |
Source: Public Records
Mortgage History
| Date | Status | Borrower | Loan Amount |
|---|---|---|---|
| Open | Weick Kevin D | $275,000 | |
| Previous Owner | Devore Irven | $314,360 |
Source: Public Records
Tax History Compared to Growth
Tax History
| Year | Tax Paid | Tax Assessment Tax Assessment Total Assessment is a certain percentage of the fair market value that is determined by local assessors to be the total taxable value of land and additions on the property. | Land | Improvement |
|---|---|---|---|---|
| 2025 | $12,016 | $1,055,000 | $707,000 | $348,000 |
| 2024 | $11,753 | $1,113,000 | $838,000 | $275,000 |
| 2023 | $11,667 | $1,038,000 | $790,000 | $248,000 |
| 2022 | $12,636 | $953,000 | $723,000 | $230,000 |
| 2021 | $12,636 | $1,095,000 | $904,000 | $191,000 |
| 2020 | $11,660 | $1,060,000 | $773,000 | $287,000 |
| 2019 | $10,538 | $903,000 | $618,000 | $285,000 |
| 2018 | $8,996 | $765,000 | $562,000 | $203,000 |
| 2017 | $8,845 | $697,000 | $494,000 | $203,000 |
| 2016 | $8,742 | $696,000 | $494,000 | $202,000 |
| 2015 | $8,075 | $626,000 | $425,000 | $201,000 |
Source: Public Records
Map
Nearby Homes
- 36 Madison St
- 263 Common St
- 105 Watson Rd
- 38 Myrtle St
- 69 Horace Rd
- 125 Trapelo Rd Unit 21
- 125 Trapelo Rd Unit 23
- 1 Spinney Terrace
- 59-61 Gilbert Rd
- 48 Concord Ave
- 118 Blanchard Rd
- 60 Kilburn Rd
- 33 Slade St Unit 1
- 73 Foster Rd Unit 2
- 72-74 Flett Rd
- 48 Hamilton Rd
- 46 Hamilton Rd
- 4 Merrill Ave
- 2 Bartlett Ave Unit 1
- 73 Trowbridge St Unit 73A