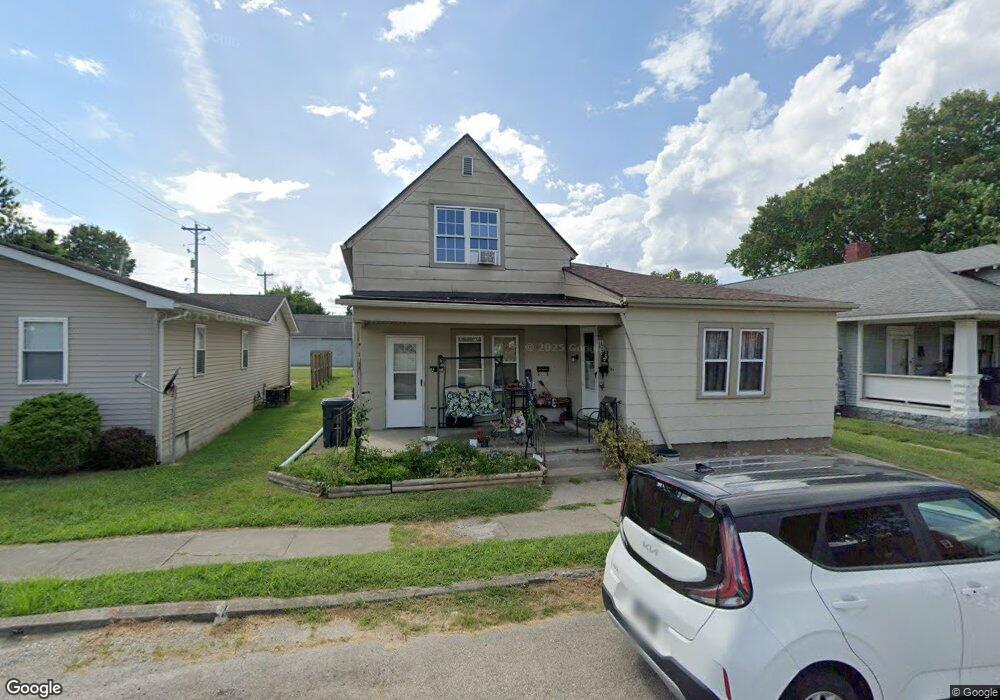
133 West St Jackson, OH 45640
Estimated Value: $181,000 - $190,759
4
Beds
3
Baths
1,884
Sq Ft
$98/Sq Ft
Est. Value
About This Home
This home is located at 133 West St, Jackson, OH 45640 and is currently estimated at $183,690, approximately $97 per square foot. 133 West St is a home located in Jackson County with nearby schools including Jackson High School and Christian Life Academy.
Ownership History
Date
Name
Owned For
Owner Type
Purchase Details
Closed on
May 28, 2021
Sold by
Erwin Mitchell and Erwin Cynthia
Bought by
Fairway Advisors Llc
Current Estimated Value
Home Financials for this Owner
Home Financials are based on the most recent Mortgage that was taken out on this home.
Original Mortgage
$93,200
Outstanding Balance
$84,381
Interest Rate
2.9%
Mortgage Type
Commercial
Estimated Equity
$99,309
Purchase Details
Closed on
Sep 1, 2011
Sold by
Chapman Betty R
Bought by
Ervin Mitchell and Ervin Cynthia
Purchase Details
Closed on
Apr 19, 2001
Sold by
Chapman Edmund G
Bought by
Chapman Betty R
Create a Home Valuation Report for This Property
The Home Valuation Report is an in-depth analysis detailing your home's value as well as a comparison with similar homes in the area
Home Values in the Area
Average Home Value in this Area
Purchase History
| Date | Buyer | Sale Price | Title Company |
|---|---|---|---|
| Fairway Advisors Llc | $116,500 | None Available | |
| Ervin Mitchell | $75,000 | None Available | |
| Chapman Betty R | -- | -- |
Source: Public Records
Mortgage History
| Date | Status | Borrower | Loan Amount |
|---|---|---|---|
| Open | Fairway Advisors Llc | $93,200 | |
| Closed | Fairway Advisors Llc | $93,200 |
Source: Public Records
Tax History Compared to Growth
Tax History
| Year | Tax Paid | Tax Assessment Tax Assessment Total Assessment is a certain percentage of the fair market value that is determined by local assessors to be the total taxable value of land and additions on the property. | Land | Improvement |
|---|---|---|---|---|
| 2024 | $1,771 | $47,740 | $5,900 | $41,840 |
| 2023 | $1,802 | $47,740 | $5,900 | $41,840 |
| 2022 | $2,075 | $40,690 | $5,700 | $34,990 |
| 2021 | $2,014 | $49,490 | $5,700 | $43,790 |
| 2020 | $1,997 | $49,490 | $5,700 | $43,790 |
| 2019 | $1,760 | $42,660 | $4,910 | $37,750 |
| 2018 | $1,696 | $42,660 | $4,910 | $37,750 |
| 2017 | $813 | $42,660 | $4,910 | $37,750 |
| 2016 | $1,217 | $31,500 | $4,910 | $26,590 |
| 2015 | $612 | $31,500 | $4,910 | $26,590 |
| 2013 | $1,173 | $30,250 | $4,910 | $25,340 |
| 2012 | $1,189 | $30,250 | $4,910 | $25,340 |
Source: Public Records
Map
Nearby Homes