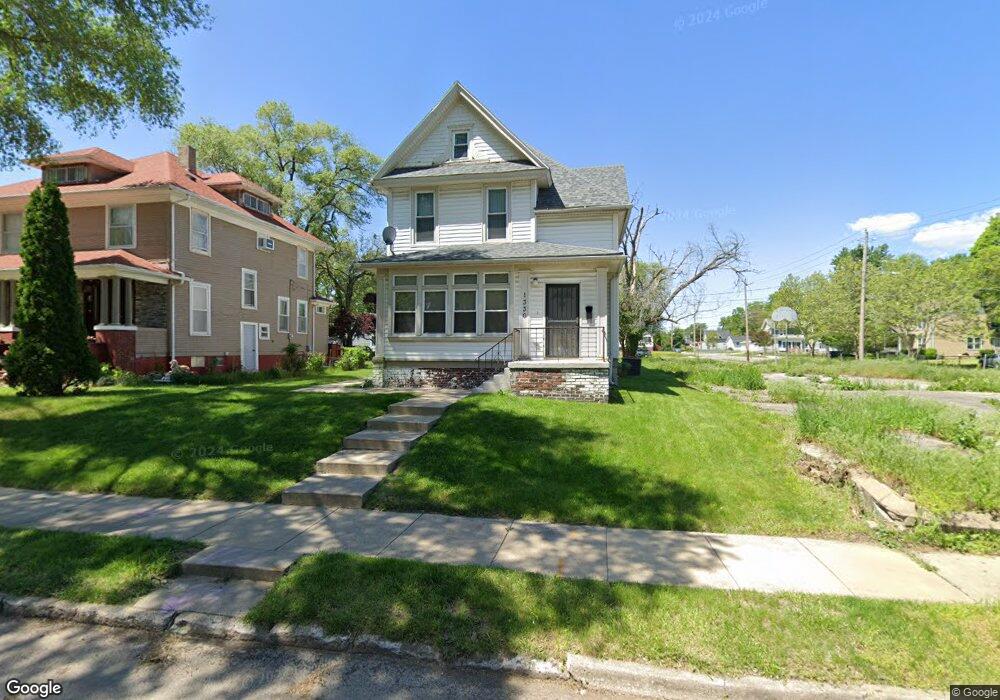
1330 10th St Des Moines, IA 50314
King Irving NeighborhoodEstimated Value: $218,000 - $233,736
4
Beds
2
Baths
2,607
Sq Ft
$87/Sq Ft
Est. Value
About This Home
This home is located at 1330 10th St, Des Moines, IA 50314 and is currently estimated at $225,934, approximately $86 per square foot. 1330 10th St is a home located in Polk County with nearby schools including Moulton Elementary School, Harding Middle School, and North High School.
Ownership History
Date
Name
Owned For
Owner Type
Purchase Details
Closed on
Aug 6, 2020
Sold by
Monds Elliott F
Bought by
Monds Elliott F and Mitchell Lana Jean
Current Estimated Value
Purchase Details
Closed on
Jun 1, 1998
Sold by
Community Housing Development Corp Inc
Bought by
Monds Elliott F
Home Financials for this Owner
Home Financials are based on the most recent Mortgage that was taken out on this home.
Original Mortgage
$57,950
Outstanding Balance
$11,491
Interest Rate
7.27%
Estimated Equity
$214,443
Purchase Details
Closed on
Mar 18, 1997
Sold by
Polk County Iowa
Bought by
Community Housing Development Corp
Create a Home Valuation Report for This Property
The Home Valuation Report is an in-depth analysis detailing your home's value as well as a comparison with similar homes in the area
Home Values in the Area
Average Home Value in this Area
Purchase History
| Date | Buyer | Sale Price | Title Company |
|---|---|---|---|
| Monds Elliott F | -- | None Available | |
| Monds Elliott F | $60,500 | -- | |
| Community Housing Development Corp | -- | -- |
Source: Public Records
Mortgage History
| Date | Status | Borrower | Loan Amount |
|---|---|---|---|
| Open | Monds Elliott F | $57,950 |
Source: Public Records
Tax History Compared to Growth
Tax History
| Year | Tax Paid | Tax Assessment Tax Assessment Total Assessment is a certain percentage of the fair market value that is determined by local assessors to be the total taxable value of land and additions on the property. | Land | Improvement |
|---|---|---|---|---|
| 2025 | $3,278 | $214,400 | $13,400 | $201,000 |
| 2024 | $3,278 | $184,100 | $11,500 | $172,600 |
| 2023 | $2,956 | $184,100 | $11,500 | $172,600 |
| 2022 | $2,932 | $134,300 | $8,700 | $125,600 |
| 2021 | $2,750 | $134,300 | $8,700 | $125,600 |
| 2020 | $2,852 | $118,800 | $7,800 | $111,000 |
| 2019 | $2,662 | $118,800 | $7,800 | $111,000 |
| 2018 | $2,630 | $107,600 | $6,900 | $100,700 |
| 2017 | $2,706 | $107,600 | $6,900 | $100,700 |
| 2016 | $2,632 | $108,600 | $6,900 | $101,700 |
| 2015 | $2,632 | $108,600 | $6,900 | $101,700 |
| 2014 | $2,322 | $96,100 | $6,800 | $89,300 |
Source: Public Records
Map
Nearby Homes