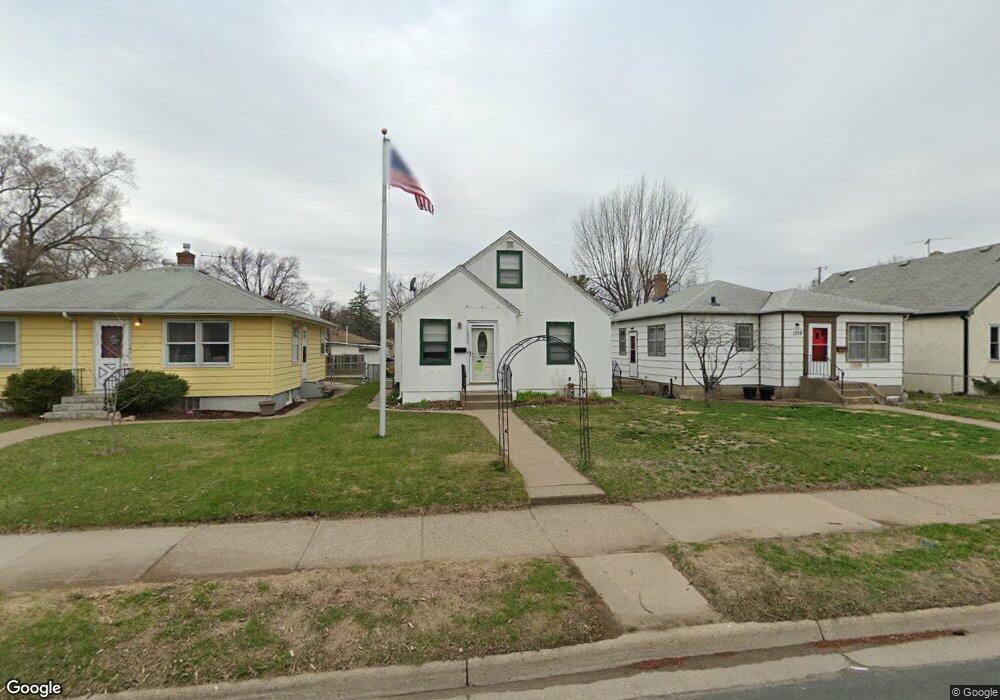
1330 1330 5th Ave S South St. Paul, MN 55075
Estimated Value: $253,000 - $287,756
3
Beds
1
Bath
992
Sq Ft
$276/Sq Ft
Est. Value
About This Home
This home is located at 1330 1330 5th Ave S, South St. Paul, MN 55075 and is currently estimated at $273,689, approximately $275 per square foot. 1330 1330 5th Ave S is a home located in Dakota County with nearby schools including Kaposia Education Center Elementary, South St. Paul Secondary, and Discovery Charter School.
Ownership History
Date
Name
Owned For
Owner Type
Purchase Details
Closed on
Sep 29, 2023
Sold by
Trygg Eben and Trygg Bethany
Bought by
Lenertz Lauren
Current Estimated Value
Home Financials for this Owner
Home Financials are based on the most recent Mortgage that was taken out on this home.
Original Mortgage
$246,547
Outstanding Balance
$241,671
Interest Rate
7.09%
Mortgage Type
New Conventional
Estimated Equity
$44,031
Purchase Details
Closed on
May 21, 2010
Sold by
Rincon Jaime and Sosa Norma
Bought by
Bauer Bethany R
Home Financials for this Owner
Home Financials are based on the most recent Mortgage that was taken out on this home.
Original Mortgage
$117,171
Interest Rate
5.5%
Mortgage Type
FHA
Purchase Details
Closed on
Mar 15, 2004
Sold by
Unavailable
Bought by
Unavailable
Purchase Details
Closed on
Jan 24, 2003
Sold by
Johnson Kathleen E
Bought by
Schleck Ray M and Schleck Ann M
Create a Home Valuation Report for This Property
The Home Valuation Report is an in-depth analysis detailing your home's value as well as a comparison with similar homes in the area
Home Values in the Area
Average Home Value in this Area
Purchase History
| Date | Buyer | Sale Price | Title Company |
|---|---|---|---|
| Lenertz Lauren | $265,000 | -- | |
| Bauer Bethany R | $118,750 | -- | |
| Unavailable | $169,900 | -- | |
| Schleck Ray M | $143,000 | -- |
Source: Public Records
Mortgage History
| Date | Status | Borrower | Loan Amount |
|---|---|---|---|
| Open | Lenertz Lauren | $246,547 | |
| Previous Owner | Bauer Bethany R | $117,171 |
Source: Public Records
Tax History Compared to Growth
Tax History
| Year | Tax Paid | Tax Assessment Tax Assessment Total Assessment is a certain percentage of the fair market value that is determined by local assessors to be the total taxable value of land and additions on the property. | Land | Improvement |
|---|---|---|---|---|
| 2024 | $3,320 | $250,800 | $53,100 | $197,700 |
| 2023 | $3,320 | $249,100 | $53,400 | $195,700 |
| 2022 | $2,446 | $231,600 | $52,700 | $178,900 |
| 2021 | $2,494 | $193,000 | $45,800 | $147,200 |
| 2020 | $2,390 | $192,700 | $43,600 | $149,100 |
| 2019 | $2,112 | $189,900 | $41,500 | $148,400 |
| 2018 | $2,034 | $165,000 | $37,800 | $127,200 |
| 2017 | $1,768 | $154,100 | $36,000 | $118,100 |
| 2016 | $1,737 | $140,800 | $32,700 | $108,100 |
| 2015 | $1,622 | $108,711 | $25,331 | $83,380 |
| 2014 | -- | $107,730 | $25,272 | $82,458 |
| 2013 | -- | $91,598 | $21,233 | $70,365 |
Source: Public Records
Map
Nearby Homes
- 1436 5th Ave S
- 1456 6th Ave S
- 1215 8th Ave S
- 1434 8th Ave S
- 5472 Bryce Ave
- 233 Richmond St W
- 1127 9th Ave S
- 101 Frost St W
- 137 South St E
- 5938 Burke Trail
- 100 W Warburton St
- 6050 Cahill Ave
- 5903 Bryant Ln
- 151 Park St W
- 928 8th Ave S
- 5870 Blackberry Bridge Path
- 4970 Boyd Ave
- 1403 Concord St S Unit 1
- TBD 65th St E
- 4898 Bitterman Path Unit 9101
- 1330 5th Ave S
- 1332 5th Ave S
- 1328 5th Ave S
- 1340 5th Ave S
- 1324 1324 5th-Avenue-s
- 1324 5th Ave S
- 1346 5th Ave S
- 1322 5th Ave S
- 1333 6th Ave S
- 1329 6th Ave S
- 1341 6th Ave S
- 1350 5th Ave S
- 257 Macarthur St W
- 1333 1333 6th-Avenue-s
- 1345 6th Ave S
- 1312 5th Ave S
- 1323 6th Ave S
- 256 256 MacArthur-street-w
- 1354 5th Ave S
- 256 Macarthur St W