Estimated Value: $462,000 - $653,000
3
Beds
3
Baths
2,319
Sq Ft
$242/Sq Ft
Est. Value
About This Home
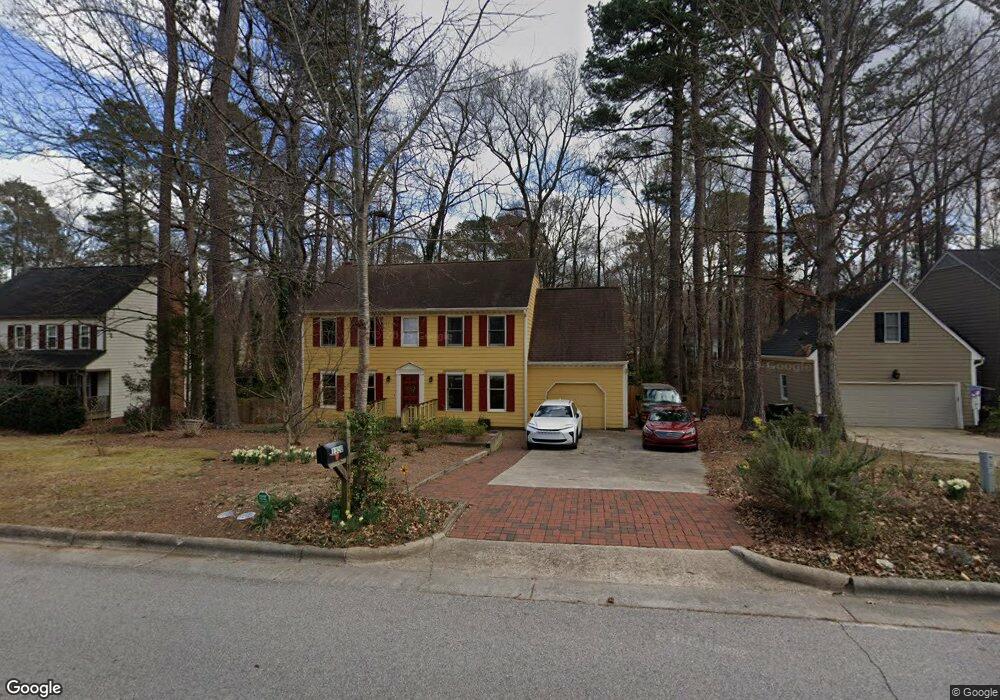
This home is located at 1330 Apache Ln, Apex, NC 27502 and is currently estimated at $561,716, approximately $242 per square foot. 1330 Apache Ln is a home located in Wake County with nearby schools including Apex Elementary School, Apex Middle, and Apex High School.
Ownership History
Date
Name
Owned For
Owner Type
Purchase Details
Closed on
Jul 19, 2011
Sold by
Flagstar Bank Fsb
Bought by
Boland James F and Boland Christina M
Current Estimated Value
Home Financials for this Owner
Home Financials are based on the most recent Mortgage that was taken out on this home.
Original Mortgage
$171,000
Outstanding Balance
$117,754
Interest Rate
4.53%
Mortgage Type
New Conventional
Estimated Equity
$443,962
Purchase Details
Closed on
May 17, 2011
Sold by
Do James Huy and Nguyen Lynn T
Bought by
Flagstar Bank Fsb
Purchase Details
Closed on
May 17, 2007
Sold by
Sura Piyush N and Sura Smita P
Bought by
Do James Huy and Nguyen Lynn T
Home Financials for this Owner
Home Financials are based on the most recent Mortgage that was taken out on this home.
Original Mortgage
$269,000
Interest Rate
5.87%
Mortgage Type
Purchase Money Mortgage
Create a Home Valuation Report for This Property
The Home Valuation Report is an in-depth analysis detailing your home's value as well as a comparison with similar homes in the area
Purchase History
| Date | Buyer | Sale Price | Title Company |
|---|---|---|---|
| Boland James F | $190,000 | None Available | |
| Flagstar Bank Fsb | $283,530 | None Available | |
| Do James Huy | $269,000 | None Available |
Source: Public Records
Mortgage History
| Date | Status | Borrower | Loan Amount |
|---|---|---|---|
| Open | Boland James F | $171,000 | |
| Previous Owner | Do James Huy | $269,000 |
Source: Public Records
Tax History
| Year | Tax Paid | Tax Assessment Tax Assessment Total Assessment is a certain percentage of the fair market value that is determined by local assessors to be the total taxable value of land and additions on the property. | Land | Improvement |
|---|---|---|---|---|
| 2025 | $4,436 | $505,779 | $200,000 | $305,779 |
| 2024 | $4,337 | $505,779 | $200,000 | $305,779 |
Source: Public Records
Map
Nearby Homes
- 1000 Chimney Hill Dr
- 119 Heatherwood Dr
- 2016 W Sterlington Place
- 1200 Boxwood Ln
- 3007 Old Raleigh Rd
- 1004 Surry Dale Ct
- 201 Pinewood Dr
- 3015 Old Raleigh Rd
- 2361 Englemann Dr
- 2374 Englemann Dr
- 2350 Englemann Dr
- 2377 Englemann Dr
- 2357 Englemann Dr
- 2369 Englemann Dr
- 2373 Englemann Dr
- 2365 Englemann Dr
- 3123 June Lake Station
- 2354 Englemann Dr
- 2370 Englemann Dr
- 634 Edgewater Ridge Ct
- 1328 Apache Ln
- 1332 Apache Ln
- 1334 Apache Ln
- 1329 Apache Ln
- 1327 Apache Ln
- 1331 Apache Ln
- 1216 Wellstone Cir
- 1325 Apache Ln
- 1324 Apache Ln
- 1218 Wellstone Cir
- 1333 Apache Ln
- 1336 Apache Ln
- 1214 Wellstone Cir
- 1300 Wellstone Cir
- 1323 Apache Ln
- 1009 Smokewood Dr
- 1335 Apache Ln
- 1007 Smokewood Dr
- 1212 Wellstone Cir
- 1011 Smokewood Dr
Your Personal Tour Guide
Ask me questions while you tour the home.