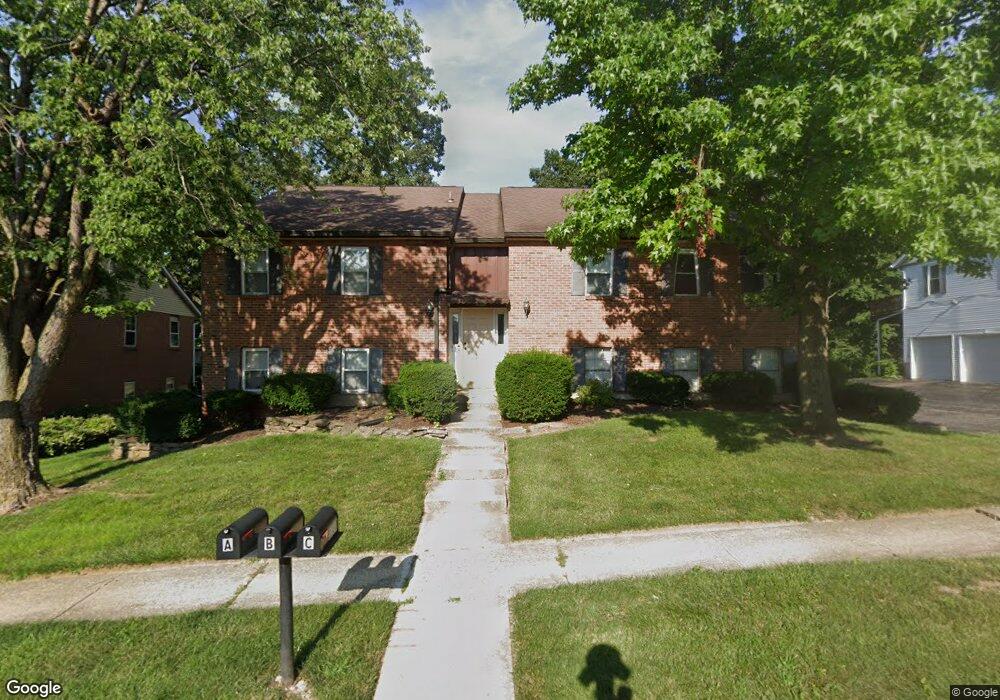
1330 Black Forest Dr Unit 16 Dayton, OH 45449
Estimated Value: $131,961 - $136,000
2
Beds
2
Baths
1,161
Sq Ft
$115/Sq Ft
Est. Value
About This Home
This home is located at 1330 Black Forest Dr Unit 16, Dayton, OH 45449 and is currently estimated at $133,990, approximately $115 per square foot. 1330 Black Forest Dr Unit 16 is a home located in Montgomery County with nearby schools including West Carrollton High School, Miami Valley Academies, and Bethel Baptist School.
Ownership History
Date
Name
Owned For
Owner Type
Purchase Details
Closed on
Jul 27, 2022
Sold by
Deborah Pummell
Bought by
Slack Kimberly I
Current Estimated Value
Purchase Details
Closed on
May 21, 2002
Sold by
Tackett Kermit L and Steele Mary J
Bought by
Pummell Deborah
Home Financials for this Owner
Home Financials are based on the most recent Mortgage that was taken out on this home.
Original Mortgage
$47,000
Interest Rate
7.07%
Purchase Details
Closed on
Jun 9, 2000
Sold by
Debord Viola
Bought by
Tackett Kermit L and Steele Mary J
Purchase Details
Closed on
Aug 30, 1999
Sold by
Blasingame Robert D
Bought by
Debord C Viola
Purchase Details
Closed on
Aug 31, 1998
Sold by
Rose Alfred C
Bought by
Blasingame Robert D
Home Financials for this Owner
Home Financials are based on the most recent Mortgage that was taken out on this home.
Original Mortgage
$38,400
Interest Rate
8.5%
Create a Home Valuation Report for This Property
The Home Valuation Report is an in-depth analysis detailing your home's value as well as a comparison with similar homes in the area
Home Values in the Area
Average Home Value in this Area
Purchase History
| Date | Buyer | Sale Price | Title Company |
|---|---|---|---|
| Slack Kimberly I | $100,000 | -- | |
| Pummell Deborah | $72,500 | -- | |
| Tackett Kermit L | $65,500 | -- | |
| Debord C Viola | $60,000 | -- | |
| Blasingame Robert D | $48,000 | -- | |
| Blasingame Robert D | $48,000 | -- |
Source: Public Records
Mortgage History
| Date | Status | Borrower | Loan Amount |
|---|---|---|---|
| Previous Owner | Pummell Deborah | $47,000 | |
| Previous Owner | Blasingame Robert D | $38,400 |
Source: Public Records
Tax History Compared to Growth
Tax History
| Year | Tax Paid | Tax Assessment Tax Assessment Total Assessment is a certain percentage of the fair market value that is determined by local assessors to be the total taxable value of land and additions on the property. | Land | Improvement |
|---|---|---|---|---|
| 2024 | $1,915 | $31,510 | $4,030 | $27,480 |
| 2023 | $1,915 | $31,510 | $4,030 | $27,480 |
| 2022 | $1,034 | $21,880 | $2,800 | $19,080 |
| 2021 | $1,036 | $21,880 | $2,800 | $19,080 |
| 2020 | $1,035 | $21,880 | $2,800 | $19,080 |
| 2019 | $1,220 | $23,140 | $2,800 | $20,340 |
| 2018 | $1,812 | $23,140 | $2,800 | $20,340 |
| 2017 | $1,799 | $23,140 | $2,800 | $20,340 |
| 2016 | $1,627 | $20,380 | $2,800 | $17,580 |
| 2015 | $1,494 | $20,380 | $2,800 | $17,580 |
| 2014 | $1,494 | $20,380 | $2,800 | $17,580 |
| 2012 | -- | $22,430 | $5,320 | $17,110 |
Source: Public Records
Map
Nearby Homes
- 609 Kings Cross Ct
- 500 Lincoln Green Dr
- 432 Crusader Dr
- 1100 S Elm St
- 1153 King Richard Pkwy
- 2125 Sherwood Forest Dr
- 275 Orchard Hill Dr
- 1606 Pine Tree Ln Unit 38
- 1109 Arrowhead Crossing Unit A
- 1104 Arrowhead Crossing Unit B
- 2302 King Richard Pkwy
- 1112 Eagle Feather Cir Unit A
- 1116 Eagle Feather Cir Unit E
- 430 Donington Dr
- 1320 S Alex Rd
- 838 Maid Marion Ct
- 354 Ellenwood Dr
- 1788 Cherokee Dr Unit F
- 1792 Cherokee Dr Unit A
- 2061 Pine Forest Dr
- 1330 Black Forest Dr Unit 18
- 1330 Black Forest Dr Unit 17
- 1330 Black Forest Dr Unit B
- 1326 Black Forest Dr Unit C
- 1326 Black Forest Dr Unit 21
- 1326 Black Forest Dr Unit 20
- 1326 Black Forest Dr Unit 19
- 1326 Black Forest Dr Unit A
- 1326 Black Forest Dr
- 1334 Black Forest Dr Unit C
- 1334 Black Forest Dr Unit 15
- 1334 Black Forest Dr Unit 14
- 1334 Black Forest Dr Unit 13
- 1334 Black Forest Dr Unit B
- 1334 Black Forest C Dr
- 1338 Black Forest Dr Unit B
- 1338 Black Forest Dr Unit 12
- 1338 Black Forest Dr Unit 11
- 1338 Black Forest Dr Unit 10
- 1338 Black Forest Dr Unit A