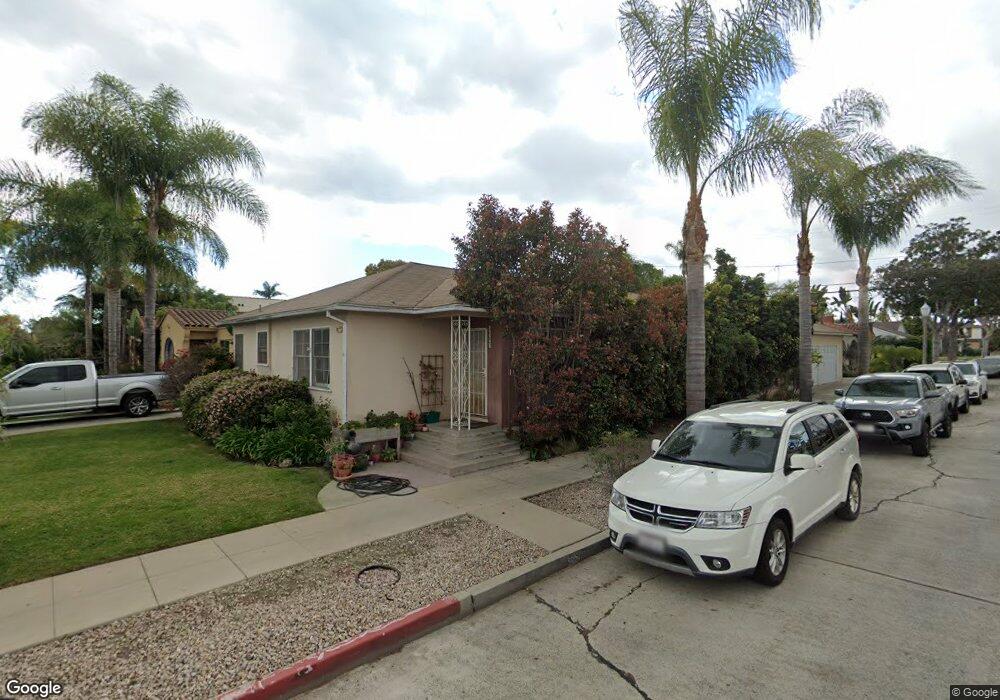
1330 E 36th St Long Beach, CA 90807
California Heights NeighborhoodEstimated Value: $1,129,913 - $1,246,000
4
Beds
2
Baths
2,407
Sq Ft
$493/Sq Ft
Est. Value
About This Home
This home is located at 1330 E 36th St, Long Beach, CA 90807 and is currently estimated at $1,187,478, approximately $493 per square foot. 1330 E 36th St is a home located in Los Angeles County with nearby schools including Longfellow Elementary School, Hughes Middle School, and Long Beach Polytechnic High School.
Ownership History
Date
Name
Owned For
Owner Type
Purchase Details
Closed on
Dec 18, 1998
Sold by
Trust Waggoner Kathy L Tr William T Wagg and Waggoner Kathy Lee
Bought by
Tombor Charles A
Current Estimated Value
Home Financials for this Owner
Home Financials are based on the most recent Mortgage that was taken out on this home.
Original Mortgage
$178,400
Outstanding Balance
$40,348
Interest Rate
6.73%
Estimated Equity
$1,147,130
Purchase Details
Closed on
May 31, 1996
Sold by
Waggoner Nova L
Bought by
Waggoner Kathy Lynn and The Nova Lee Waggoner 1994 Trust
Purchase Details
Closed on
Feb 20, 1996
Sold by
Waggoner Kathy Lynn and The Nova Lee Waggoner 1994 Tru
Bought by
Waggoner Nova L
Home Financials for this Owner
Home Financials are based on the most recent Mortgage that was taken out on this home.
Original Mortgage
$104,000
Interest Rate
7.04%
Purchase Details
Closed on
Jan 24, 1994
Sold by
Waggoner Nova Lee
Bought by
Waggoner Kathy Lynn
Create a Home Valuation Report for This Property
The Home Valuation Report is an in-depth analysis detailing your home's value as well as a comparison with similar homes in the area
Home Values in the Area
Average Home Value in this Area
Purchase History
| Date | Buyer | Sale Price | Title Company |
|---|---|---|---|
| Tombor Charles A | $223,000 | Gateway Title Company | |
| Waggoner Kathy Lynn | -- | -- | |
| Waggoner Nova L | -- | Old Republic Title | |
| Waggoner Kathy Lynn | -- | -- |
Source: Public Records
Mortgage History
| Date | Status | Borrower | Loan Amount |
|---|---|---|---|
| Open | Tombor Charles A | $178,400 | |
| Previous Owner | Waggoner Nova L | $104,000 |
Source: Public Records
Tax History
| Year | Tax Paid | Tax Assessment Tax Assessment Total Assessment is a certain percentage of the fair market value that is determined by local assessors to be the total taxable value of land and additions on the property. | Land | Improvement |
|---|---|---|---|---|
| 2025 | $4,783 | $349,574 | $159,894 | $189,680 |
| 2024 | $4,783 | $342,720 | $156,759 | $185,961 |
| 2023 | $4,702 | $336,001 | $153,686 | $182,315 |
| 2022 | $4,425 | $329,414 | $150,673 | $178,741 |
| 2021 | $4,326 | $322,956 | $147,719 | $175,237 |
| 2019 | $4,265 | $313,380 | $143,339 | $170,041 |
| 2018 | $4,093 | $307,236 | $140,529 | $166,707 |
| 2016 | $3,755 | $295,308 | $135,073 | $160,235 |
| 2015 | $3,610 | $290,874 | $133,045 | $157,829 |
| 2014 | $3,593 | $285,177 | $130,439 | $154,738 |
Source: Public Records
Map
Nearby Homes
- 3495 Gaviota Ave
- 1540 E Wardlow Rd
- 3628 Rose Ave
- 3305 Brayton Ave
- 3711 Lemon Ave
- 0 Cherry Ave Unit 26640275
- 1450 E Armando Dr
- 3431 Myrtle Ave
- 3327 California Ave Unit 2
- 3360 Myrtle Ave
- 3565 3565 Linden Unit 235
- 3928 Lemon Ave
- 3965 N Marshall Way
- 3930 Myrtle Ave
- 509 E 37th St
- 3565 Linden Ave Unit 306
- 3565 Linden Ave
- 3565 Linden Ave Unit 255
- 3565 Linden Ave Unit 323
- 3565 Linden Ave Unit 226
- 3587 Gundry Ave
- 3577 Gundry Ave Unit 1/2
- 3577 Gundry Ave
- 3601 Gundry Ave
- 1320 E 36th St
- 3567 Gundry Ave
- 3605 Gundry Ave
- 3596 Gundry Ave
- 3588 Brayton Ave
- 3598 Brayton Ave
- 3602 Brayton Ave
- 3580 Brayton Ave
- 3590 Gundry Ave Unit 1/2
- 3590 Gundry Ave
- 3565 Gundry Ave
- 3563 Gundry Ave
- 3611 Gundry Ave
- 3570 Brayton Ave
- 3602 Gundry Ave
- 1420 E 36th St
Your Personal Tour Guide
Ask me questions while you tour the home.