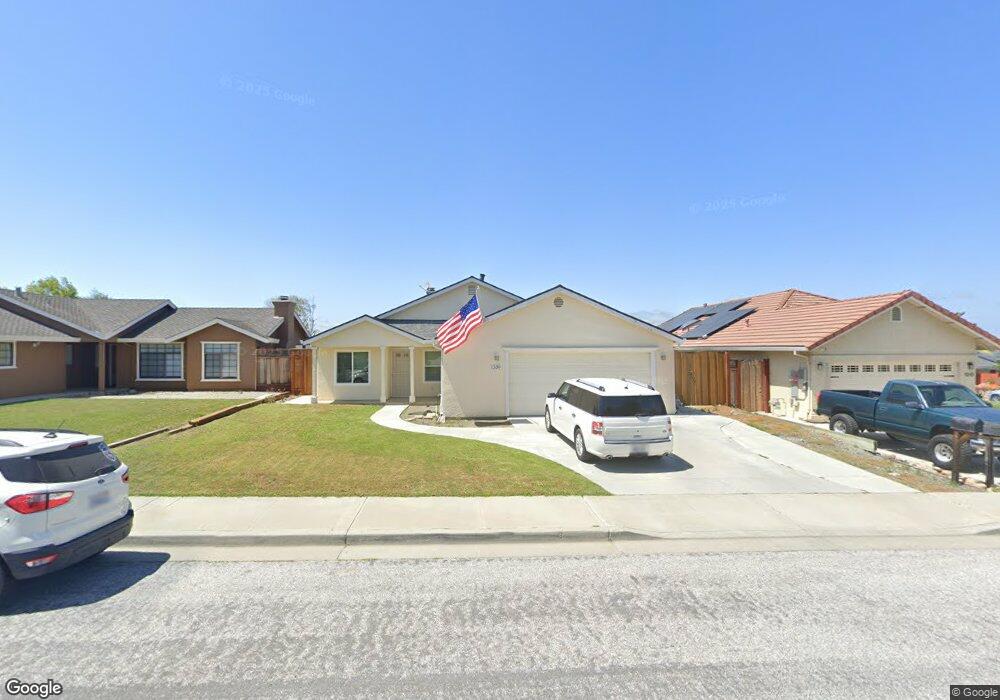
1330 El Cerro Dr Hollister, CA 95023
Estimated Value: $689,000 - $737,000
4
Beds
2
Baths
1,535
Sq Ft
$465/Sq Ft
Est. Value
About This Home
This home is located at 1330 El Cerro Dr, Hollister, CA 95023 and is currently estimated at $713,604, approximately $464 per square foot. 1330 El Cerro Dr is a home located in San Benito County with nearby schools including Sunnyslope Elementary School, Maze Middle School, and San Benito High School.
Ownership History
Date
Name
Owned For
Owner Type
Purchase Details
Closed on
Jan 22, 2009
Sold by
Fdic
Bought by
Mallin Mark and Mallin Gina
Current Estimated Value
Home Financials for this Owner
Home Financials are based on the most recent Mortgage that was taken out on this home.
Original Mortgage
$274,928
Outstanding Balance
$172,194
Interest Rate
5.01%
Mortgage Type
FHA
Estimated Equity
$541,410
Purchase Details
Closed on
Nov 28, 2008
Sold by
Jimenez Michael S
Bought by
Indymac Bank Fsb
Home Financials for this Owner
Home Financials are based on the most recent Mortgage that was taken out on this home.
Original Mortgage
$274,928
Outstanding Balance
$172,194
Interest Rate
5.01%
Mortgage Type
FHA
Estimated Equity
$541,410
Purchase Details
Closed on
Mar 22, 2005
Sold by
Dahl Barbara Jane
Bought by
Jimenez Michael
Home Financials for this Owner
Home Financials are based on the most recent Mortgage that was taken out on this home.
Original Mortgage
$468,000
Interest Rate
4.99%
Mortgage Type
Purchase Money Mortgage
Create a Home Valuation Report for This Property
The Home Valuation Report is an in-depth analysis detailing your home's value as well as a comparison with similar homes in the area
Home Values in the Area
Average Home Value in this Area
Purchase History
| Date | Buyer | Sale Price | Title Company |
|---|---|---|---|
| Mallin Mark | $280,000 | Chicago Title Company | |
| Indymac Bank Fsb | $254,444 | None Available | |
| Jimenez Michael | $585,000 | First American Title Co |
Source: Public Records
Mortgage History
| Date | Status | Borrower | Loan Amount |
|---|---|---|---|
| Open | Mallin Mark | $274,928 | |
| Previous Owner | Jimenez Michael | $468,000 | |
| Closed | Jimenez Michael | $117,000 |
Source: Public Records
Tax History Compared to Growth
Tax History
| Year | Tax Paid | Tax Assessment Tax Assessment Total Assessment is a certain percentage of the fair market value that is determined by local assessors to be the total taxable value of land and additions on the property. | Land | Improvement |
|---|---|---|---|---|
| 2025 | $4,319 | $360,555 | $128,767 | $231,788 |
| 2023 | $4,319 | $346,557 | $123,768 | $222,789 |
| 2022 | $4,163 | $339,763 | $121,342 | $218,421 |
| 2021 | $4,105 | $333,102 | $118,963 | $214,139 |
| 2020 | $4,122 | $329,688 | $117,744 | $211,944 |
| 2019 | $4,003 | $323,225 | $115,436 | $207,789 |
| 2018 | $3,923 | $316,888 | $113,173 | $203,715 |
| 2017 | $3,870 | $310,675 | $110,954 | $199,721 |
| 2016 | $3,642 | $304,584 | $108,779 | $195,805 |
| 2015 | $3,607 | $300,010 | $107,146 | $192,864 |
| 2014 | $3,394 | $294,135 | $105,048 | $189,087 |
Source: Public Records
Map
Nearby Homes
- 1150 Bonnie View Rd
- 1573 Valley View Rd
- 930 Bonnie View Dr
- 841 Calais Dr
- 1090 Los Altos Dr
- 1671 Monticello Dr
- 1101 Freedom Dr
- 931 Hillcrest Rd
- 1601 Sunnyslope Rd
- 1591 Hillcrest Rd
- 1680 El Camino de Vida
- 1590 Diablo Dr
- 1180 Cherry Peak Way
- 791 El Camino Paraiso
- 1231 Westward Dr
- 971 Cherry St
- 1251 Mulberry St
- 1361 Westward Dr
- 1640 Sunset Dr
- 950 Peach Ct
- 1310 El Cerro Dr Unit 2
- 1370 El Cerro Dr
- 1285 Forest Creek Dr
- 1390 El Cerro Dr
- 1280 Heather Glen Cir
- 1260 Heather Glen Cir
- 1265 Forest Creek Dr
- 1400 El Cerro Dr
- 1290 Forest Creek Dr
- 1285 Heather Glen Cir
- 1295 El Cerro Dr
- 1280 Forest Creek Dr
- 1331 El Cerro Dr
- 1245 Forest Creek Dr
- 1391 El Cerro Dr
- 1311 El Cerro Dr
- 1240 Heather Glen Cir
- 1420 El Cerro Dr
- 1401 El Cerro Dr
- 1260 Forest Creek Dr