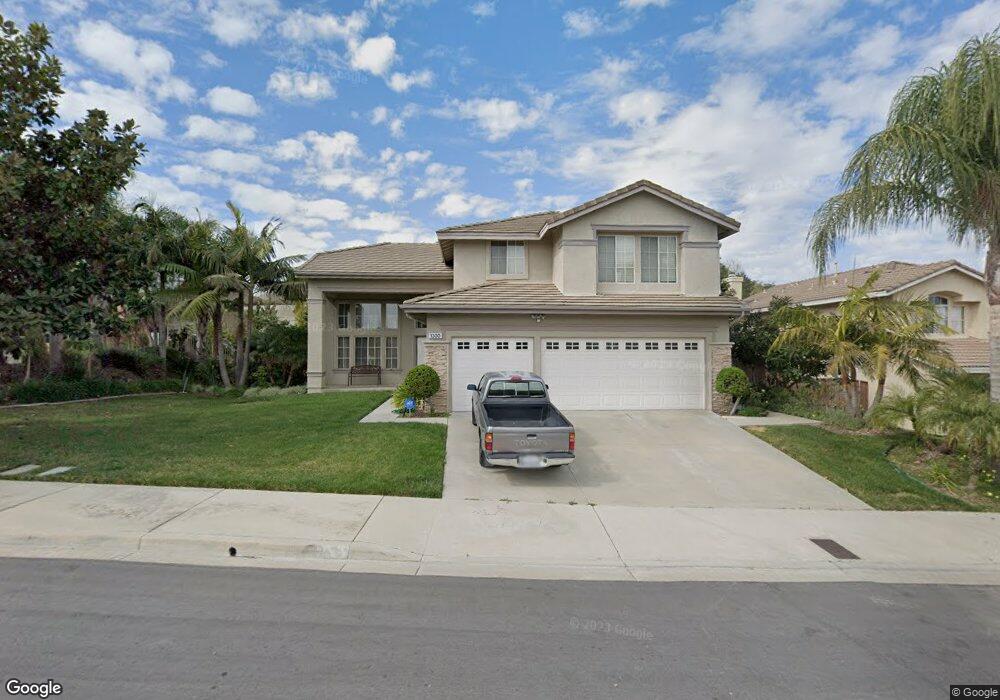
1330 Gold Shadow Ln Chino Hills, CA 91709
North Chino Hills NeighborhoodEstimated Value: $1,324,573 - $1,445,000
5
Beds
3
Baths
2,702
Sq Ft
$517/Sq Ft
Est. Value
About This Home
This home is located at 1330 Gold Shadow Ln, Chino Hills, CA 91709 and is currently estimated at $1,396,143, approximately $516 per square foot. 1330 Gold Shadow Ln is a home located in San Bernardino County with nearby schools including Hidden Trails Elementary School, Canyon Hills Junior High School, and Ruben S. Ayala High School.
Ownership History
Date
Name
Owned For
Owner Type
Purchase Details
Closed on
Jul 20, 2019
Sold by
To Kiet Binh and Lee Karen
Bought by
To Kiet Binh and Lee Karen
Current Estimated Value
Purchase Details
Closed on
Feb 5, 2008
Sold by
Watanabe Wayne M and Watanabe Judith A
Bought by
To Kiet Binh and Lee Karen
Home Financials for this Owner
Home Financials are based on the most recent Mortgage that was taken out on this home.
Original Mortgage
$285,000
Outstanding Balance
$176,834
Interest Rate
5.75%
Mortgage Type
Purchase Money Mortgage
Estimated Equity
$1,219,309
Purchase Details
Closed on
May 26, 2000
Sold by
Watanabe Wayne M and Watanabe Judith A
Bought by
Watanabe Wayne M and Watanabe Judith A
Purchase Details
Closed on
Nov 22, 1995
Sold by
Lyon/Copley Associates Lp
Bought by
Watanabe Wayne M and Watanabe Judith A
Home Financials for this Owner
Home Financials are based on the most recent Mortgage that was taken out on this home.
Original Mortgage
$145,500
Interest Rate
7.38%
Create a Home Valuation Report for This Property
The Home Valuation Report is an in-depth analysis detailing your home's value as well as a comparison with similar homes in the area
Home Values in the Area
Average Home Value in this Area
Purchase History
| Date | Buyer | Sale Price | Title Company |
|---|---|---|---|
| To Kiet Binh | -- | None Available | |
| To Kiet Binh | $685,000 | Western Resources Title | |
| Watanabe Wayne M | -- | -- | |
| Watanabe Wayne M | $268,500 | First American Title Ins Co |
Source: Public Records
Mortgage History
| Date | Status | Borrower | Loan Amount |
|---|---|---|---|
| Open | To Kiet Binh | $285,000 | |
| Previous Owner | Watanabe Wayne M | $145,500 |
Source: Public Records
Tax History Compared to Growth
Tax History
| Year | Tax Paid | Tax Assessment Tax Assessment Total Assessment is a certain percentage of the fair market value that is determined by local assessors to be the total taxable value of land and additions on the property. | Land | Improvement |
|---|---|---|---|---|
| 2025 | $10,168 | $899,763 | $314,917 | $584,846 |
| 2024 | $10,168 | $882,120 | $308,742 | $573,378 |
| 2023 | $9,898 | $864,823 | $302,688 | $562,135 |
| 2022 | $9,841 | $847,866 | $296,753 | $551,113 |
| 2021 | $9,658 | $831,241 | $290,934 | $540,307 |
| 2020 | $10,162 | $822,718 | $287,951 | $534,767 |
| 2019 | $10,068 | $806,586 | $282,305 | $524,281 |
| 2018 | $9,858 | $790,771 | $276,770 | $514,001 |
| 2017 | $9,690 | $775,266 | $271,343 | $503,923 |
| 2016 | $9,113 | $760,065 | $266,023 | $494,042 |
| 2015 | $8,940 | $748,648 | $262,027 | $486,621 |
| 2014 | $8,772 | $733,983 | $256,894 | $477,089 |
Source: Public Records
Map
Nearby Homes
- 15208 Calle Lomita
- 15877 Esquilime Dr
- 1850 Fairway Dr Unit 47
- 1850 Fairway Dr Unit 48
- 2024 Vista Del Sol
- 16179 Lantern Ln
- Plan 3 at Serenity Grove
- Plan 1 at Serenity Grove
- Plan 2 at Serenity Grove
- 16107 Lantern Ln
- 16143 Lantern Ln
- 2137 Turquoise Cir
- 2153 Turquoise Cir
- 15030 Camino Arroyo
- 1079 Spring Oak Way
- 15075 Avenida Del Monte
- 1588 Red Apple Ln
- 2222 Carbon Canyon Rd
- 2 CUTOFF Old Carbon Canyon Rd
- 13 Old Carbon Canyon Rd
- 1340 Gold Shadow Ln
- 1350 Gold Shadow Ln
- 15067 Avenida Compadres
- 1325 Gold Shadow Ln
- 1315 Gold Shadow Ln
- 1335 Gold Shadow Ln
- 15063 Avenida Compadres
- 1345 Gold Shadow Ln
- 1360 Gold Shadow Ln
- 15059 Avenida Compadres
- 1355 Gold Shadow Ln
- 15048 Avenida Compadres
- 14870 Country Creek Ct
- 14982 Forest Spring Ct
- 15051 Avenida Compadres
- 1365 Gold Shadow Ln
- 14862 Country Creek Ct
- 15044 Avenida Compadres
- 14974 Forest Spring Ct
- 14878 Country Creek Ct