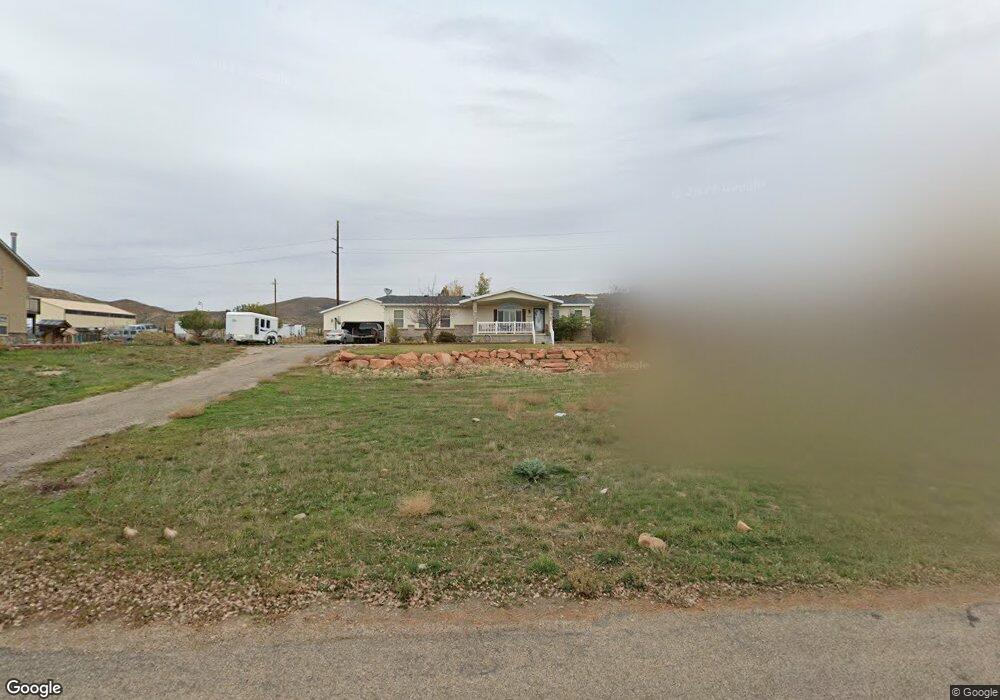
1330 N E Henefer Rd Henefer, UT 84033
Estimated Value: $623,000 - $790,764
6
Beds
3
Baths
3,452
Sq Ft
$205/Sq Ft
Est. Value
About This Home
This home is located at 1330 N E Henefer Rd, Henefer, UT 84033 and is currently estimated at $706,441, approximately $204 per square foot. 1330 N E Henefer Rd is a home located in Summit County with nearby schools including North Summit Middle School, North Summit Elementary School, and North Summit High School.
Ownership History
Date
Name
Owned For
Owner Type
Purchase Details
Closed on
Apr 2, 2020
Sold by
Heil Brandon Keith and Heil Marci S
Bought by
Vanvalkenburg Jesse
Current Estimated Value
Home Financials for this Owner
Home Financials are based on the most recent Mortgage that was taken out on this home.
Original Mortgage
$403,750
Outstanding Balance
$357,674
Interest Rate
3.4%
Mortgage Type
New Conventional
Estimated Equity
$348,767
Purchase Details
Closed on
May 1, 2014
Sold by
Matthew Phillip Lee and Matthew Cindy T
Bought by
Heill Brandon Keith and Heill Marie S
Home Financials for this Owner
Home Financials are based on the most recent Mortgage that was taken out on this home.
Original Mortgage
$295,000
Interest Rate
4.28%
Mortgage Type
VA
Create a Home Valuation Report for This Property
The Home Valuation Report is an in-depth analysis detailing your home's value as well as a comparison with similar homes in the area
Home Values in the Area
Average Home Value in this Area
Purchase History
| Date | Buyer | Sale Price | Title Company |
|---|---|---|---|
| Vanvalkenburg Jesse | -- | Us Title Insurance Agency | |
| Heill Brandon Keith | -- | Unlimited Title |
Source: Public Records
Mortgage History
| Date | Status | Borrower | Loan Amount |
|---|---|---|---|
| Open | Vanvalkenburg Jesse | $403,750 | |
| Previous Owner | Heill Brandon Keith | $295,000 |
Source: Public Records
Tax History Compared to Growth
Tax History
| Year | Tax Paid | Tax Assessment Tax Assessment Total Assessment is a certain percentage of the fair market value that is determined by local assessors to be the total taxable value of land and additions on the property. | Land | Improvement |
|---|---|---|---|---|
| 2024 | $2,173 | $386,515 | $88,163 | $298,352 |
| 2023 | $2,173 | $391,789 | $81,975 | $309,814 |
| 2022 | $1,893 | $296,843 | $81,975 | $214,868 |
| 2021 | $1,769 | $225,580 | $61,350 | $164,230 |
| 2020 | $3,032 | $393,185 | $95,100 | $298,085 |
| 2019 | $1,791 | $220,541 | $47,600 | $172,941 |
| 2018 | $1,659 | $174,990 | $47,600 | $127,390 |
| 2017 | $1,589 | $174,990 | $47,600 | $127,390 |
| 2016 | $1,642 | $174,990 | $47,600 | $127,390 |
| 2015 | $1,505 | $174,990 | $0 | $0 |
| 2013 | $1,340 | $147,582 | $0 | $0 |
Source: Public Records
Map
Nearby Homes
- 510 N Main St
- 125 E Canyon Rd
- 335 Memorial Park Rd
- 209 E Main St
- 12602 Skyline Rd Unit 130
- 141 Sky Line Rd Unit 141
- 10976 Skyline Rd Unit 202
- 1290 S Echo Rd
- 192 S Finch Cir
- 269 River Cove Dr
- 77 N River Cove Cir
- 375 E 125 N Unit 11
- 370 S State St
- 70 S 100 E
- 78 W 200 S
- 1069 Sego Ct Unit 21
- 267 Mackenzie Ln Unit 17
- 283 Mackenzie Ln Unit 15
- 278 E 300 N
- 5959 N 5000 W
- 1330 N East Henefer Rd
- 1330 N East Henefer Rd
- 1330 N East Henefer Rd
- 1340 N East Henefer Rd
- 1321 N East Henefer Rd
- 1303 N East Henefer Rd
- 1349 N East Henefer Rd
- 909 E Henefer Rd
- 1349 N East Henefer Rd
- 1350 N East Henefer Rd
- 1360 N East Henefer Rd
- 1390 N East Henefer Rd
- 1245 S Henefer Rd
- 1245 S Henefer Rd Unit C
- 1245 S Henefer Rd Unit D
- 1245 S Henefer Rd Unit B
- 1625 N East Henefer Rd Unit 2
- 1625 N East Henefer Rd
- 0 E Henefer Rd Unit 9994491
- 94 E Main St