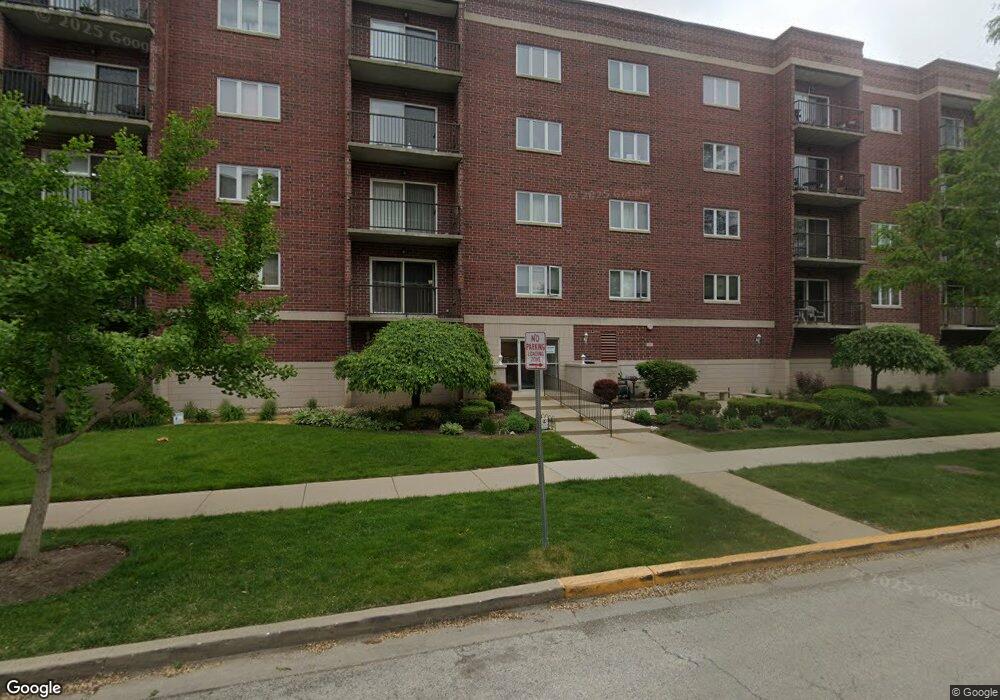
1330 Perry St Unit 404 Des Plaines, IL 60016
Estimated Value: $296,674 - $343,000
2
Beds
2
Baths
55,010
Sq Ft
$6/Sq Ft
Est. Value
About This Home
This home is located at 1330 Perry St Unit 404, Des Plaines, IL 60016 and is currently estimated at $311,669, approximately $5 per square foot. 1330 Perry St Unit 404 is a home located in Cook County with nearby schools including North Elementary School, Chippewa Middle School, and Maine West High School.
Ownership History
Date
Name
Owned For
Owner Type
Purchase Details
Closed on
Mar 21, 2018
Sold by
Quintana Julio C
Bought by
Livi Castillo Julio C Quintana and Livi Julio C Quintana Castillo
Current Estimated Value
Purchase Details
Closed on
Dec 3, 2007
Sold by
Fraley Carol Ann and Marylyn K Cipolla Trust
Bought by
Quintana Julio C
Home Financials for this Owner
Home Financials are based on the most recent Mortgage that was taken out on this home.
Original Mortgage
$223,250
Outstanding Balance
$141,089
Interest Rate
6.27%
Mortgage Type
Purchase Money Mortgage
Estimated Equity
$170,580
Purchase Details
Closed on
Oct 5, 1995
Sold by
Cipolla Marylyn K
Bought by
Cipolla Marylyn K and Marylyn K Cipolla Trust
Purchase Details
Closed on
Apr 5, 1995
Sold by
First Bank National Assn
Bought by
Cipolla Marylyn K
Create a Home Valuation Report for This Property
The Home Valuation Report is an in-depth analysis detailing your home's value as well as a comparison with similar homes in the area
Home Values in the Area
Average Home Value in this Area
Purchase History
| Date | Buyer | Sale Price | Title Company |
|---|---|---|---|
| Livi Castillo Julio C Quintana | -- | None Available | |
| Quintana Julio C | $235,000 | Pntn | |
| Cipolla Marylyn K | -- | -- | |
| Cipolla Marylyn K | $129,000 | -- |
Source: Public Records
Mortgage History
| Date | Status | Borrower | Loan Amount |
|---|---|---|---|
| Open | Quintana Julio C | $223,250 |
Source: Public Records
Tax History Compared to Growth
Tax History
| Year | Tax Paid | Tax Assessment Tax Assessment Total Assessment is a certain percentage of the fair market value that is determined by local assessors to be the total taxable value of land and additions on the property. | Land | Improvement |
|---|---|---|---|---|
| 2024 | $4,499 | $20,380 | $573 | $19,807 |
| 2023 | $4,364 | $20,380 | $573 | $19,807 |
| 2022 | $4,364 | $20,380 | $573 | $19,807 |
| 2021 | $4,017 | $16,400 | $465 | $15,935 |
| 2020 | $4,019 | $16,400 | $465 | $15,935 |
| 2019 | $3,995 | $18,275 | $465 | $17,810 |
| 2018 | $3,324 | $14,550 | $412 | $14,138 |
| 2017 | $3,283 | $14,550 | $412 | $14,138 |
| 2016 | $3,349 | $14,550 | $412 | $14,138 |
| 2015 | $2,633 | $11,332 | $358 | $10,974 |
| 2014 | $2,593 | $11,332 | $358 | $10,974 |
| 2013 | $2,511 | $11,332 | $358 | $10,974 |
Source: Public Records
Map
Nearby Homes
- 1353 Perry St Unit 6
- 1363 Perry St Unit 1B
- 1389 Perry St Unit 303
- 1258 Brown St Unit 302
- 476 Alles St Unit 210
- 476 Alles St Unit 508
- 395 Graceland Ave Unit 207
- 395 Graceland Ave Unit 308
- 1279 Harding Ave Unit 2B
- 501 Alles St Unit 501A
- 550 Ida St Unit 2NW
- 365 Graceland Ave Unit 205A
- 430 Oak St
- 1470 Jefferson St Unit 405
- 390 S Western Ave Unit 604
- 370 S Western Ave Unit 505
- 1433 Willow Ave
- 1177 Colfax Ave
- 1057 Hollywood Ave
- 555 S River Rd Unit 301
- 1330 Perry St Unit 204
- 1330 Perry St Unit 506
- 1330 Perry St Unit 505
- 1330 Perry St Unit 508
- 1330 Perry St Unit 303
- 1330 Perry St Unit 401
- 1330 Perry St Unit 202
- 1330 Perry St Unit 201
- 1330 Perry St Unit 503
- 1330 Perry St Unit 208
- 1330 Perry St Unit 207
- 1330 Perry St Unit 203
- 1330 Perry St Unit 206
- 1330 Perry St Unit 405
- 1330 Perry St Unit 502
- 1330 Perry St Unit 501
- 1330 Perry St Unit 504
- 1330 Perry St Unit 403
- 1330 Perry St Unit 402
- 1330 Perry St Unit 304