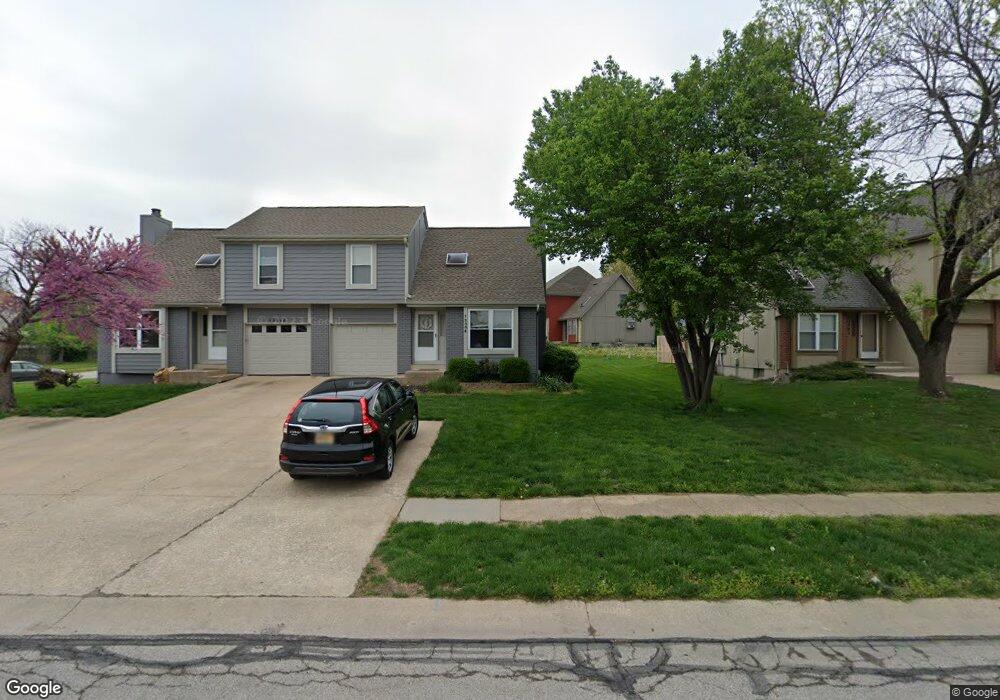
13308 W 109th Terrace Overland Park, KS 66210
Central Overland Park NeighborhoodEstimated Value: $253,000 - $285,322
3
Beds
3
Baths
1,196
Sq Ft
$224/Sq Ft
Est. Value
About This Home
This home is located at 13308 W 109th Terrace, Overland Park, KS 66210 and is currently estimated at $268,081, approximately $224 per square foot. 13308 W 109th Terrace is a home located in Johnson County with nearby schools including Walnut Grove Elementary School, Pioneer Trail Middle School, and Olathe East Sr High School.
Ownership History
Date
Name
Owned For
Owner Type
Purchase Details
Closed on
Oct 21, 2005
Sold by
Stewart Lloyd E and Stewart Sarah L
Bought by
Hansen Douglas L and Hansen Janice E
Current Estimated Value
Home Financials for this Owner
Home Financials are based on the most recent Mortgage that was taken out on this home.
Original Mortgage
$96,000
Outstanding Balance
$51,351
Interest Rate
5.75%
Mortgage Type
New Conventional
Estimated Equity
$216,730
Purchase Details
Closed on
Oct 26, 2001
Sold by
Vlk Enterprises Inc
Bought by
Stewart Lloyd E
Home Financials for this Owner
Home Financials are based on the most recent Mortgage that was taken out on this home.
Original Mortgage
$106,250
Interest Rate
6.57%
Purchase Details
Closed on
Sep 12, 2001
Sold by
Foreman Michael J
Bought by
Vlk Enterprises Inc
Home Financials for this Owner
Home Financials are based on the most recent Mortgage that was taken out on this home.
Original Mortgage
$106,250
Interest Rate
6.57%
Create a Home Valuation Report for This Property
The Home Valuation Report is an in-depth analysis detailing your home's value as well as a comparison with similar homes in the area
Home Values in the Area
Average Home Value in this Area
Purchase History
| Date | Buyer | Sale Price | Title Company |
|---|---|---|---|
| Hansen Douglas L | -- | Chicago Title Insurance Co | |
| Stewart Lloyd E | -- | Columbian National Title Ins | |
| Vlk Enterprises Inc | -- | Columbian National Title Ins |
Source: Public Records
Mortgage History
| Date | Status | Borrower | Loan Amount |
|---|---|---|---|
| Open | Hansen Douglas L | $96,000 | |
| Previous Owner | Stewart Lloyd E | $106,250 |
Source: Public Records
Tax History Compared to Growth
Tax History
| Year | Tax Paid | Tax Assessment Tax Assessment Total Assessment is a certain percentage of the fair market value that is determined by local assessors to be the total taxable value of land and additions on the property. | Land | Improvement |
|---|---|---|---|---|
| 2024 | $3,000 | $24,725 | $4,683 | $20,042 |
| 2023 | $2,955 | $23,552 | $4,256 | $19,296 |
| 2022 | $2,648 | $20,550 | $3,867 | $16,683 |
| 2021 | $2,714 | $19,849 | $3,517 | $16,332 |
| 2020 | $2,588 | $18,722 | $3,517 | $15,205 |
| 2019 | $2,523 | $18,112 | $2,931 | $15,181 |
| 2018 | $2,210 | $16,744 | $2,931 | $13,813 |
| 2017 | $2,140 | $14,800 | $2,662 | $12,138 |
| 2016 | $2,048 | $14,467 | $2,422 | $12,045 |
| 2015 | $2,058 | $14,548 | $2,422 | $12,126 |
| 2013 | -- | $13,375 | $2,422 | $10,953 |
Source: Public Records
Map
Nearby Homes
- 10951 Gillette St
- 12946 W 110th St
- 10909 Gillette St
- 10901 Gillette St
- 12786 W 110th Terrace
- 12641 W 110th Terrace
- 10981 Rosehill Rd
- 12623 W 110th Terrace
- 12659 W 110th Terrace
- 10997 Rosehill Rd
- 12782 W 108th Terrace
- 12808 W 108th St
- 10863 Rosehill Rd
- 12707 W 108th Terrace
- 10853 Rosehill Rd
- 12696 W 108th Terrace
- 13928 W 109th St
- 11262 S Rene St Unit 2800
- 13401 W 105th Terrace
- 11328 S Rene St
- 13302 W 109th Terrace
- 13310 W 109th Terrace
- 13314 W 109th Terrace
- 13334 W 109th Terrace
- 13309 W 109th Terrace
- 13313 W 109th Terrace
- 13307 W 109th Terrace
- 13315 W 109th Terrace
- 10936 Hauser St
- 13332 W 109th Terrace
- 10930 Hauser St
- 13303 W 109th Terrace
- 13319 W 109th Terrace
- 13320 W 109th Terrace
- 13320 W 109th Terrace Unit 13322 W 109th Terrac
- 13301 W 109th Terrace
- 10924 Hauser St
- 13326 W 109th Terrace
- 13332 W 109th Terrace
- 13321 W 109th Terrace