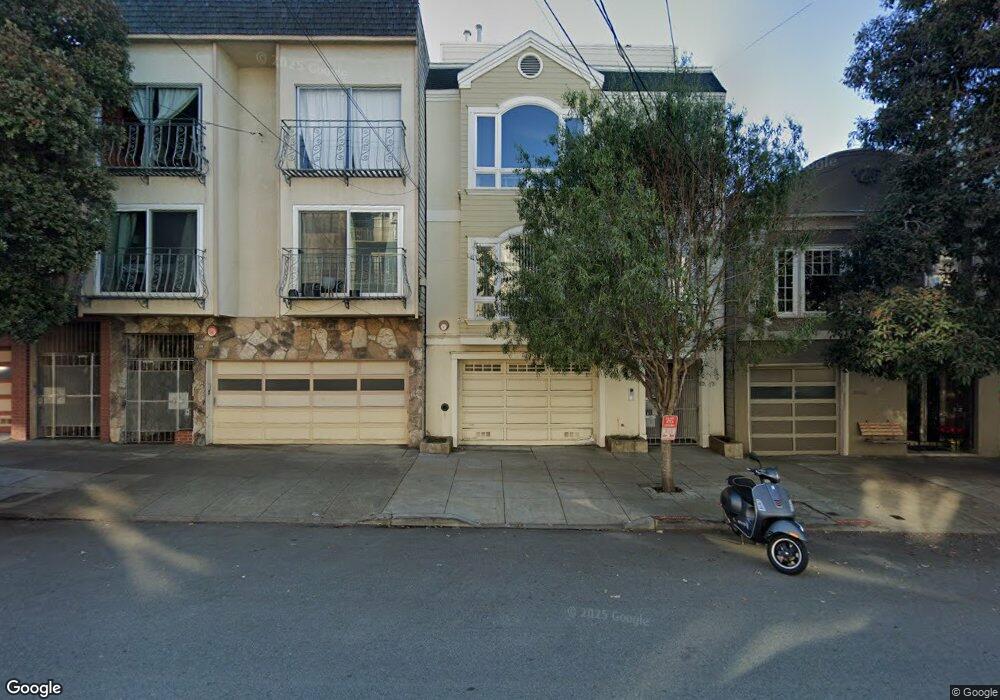
1331 10th Ave Unit 1 San Francisco, CA 94122
Inner Sunset NeighborhoodEstimated Value: $1,466,000 - $1,802,000
3
Beds
3
Baths
2,179
Sq Ft
$730/Sq Ft
Est. Value
About This Home
This home is located at 1331 10th Ave Unit 1, San Francisco, CA 94122 and is currently estimated at $1,590,751, approximately $730 per square foot. 1331 10th Ave Unit 1 is a home located in San Francisco County with nearby schools including Jefferson Elementary School, Giannini (A.P.) Middle School, and Cornerstone Academy-Lawton Campus.
Ownership History
Date
Name
Owned For
Owner Type
Purchase Details
Closed on
Jul 1, 2021
Sold by
Ng Yin Dor and Suk Lan
Bought by
Ng Trust and Ng
Current Estimated Value
Purchase Details
Closed on
Aug 29, 2017
Sold by
Ng Yin Dor and Ng Suk Lan
Bought by
Ng Yin Dor and Ng Suk Lan
Purchase Details
Closed on
Sep 12, 2003
Sold by
Ng Yin Dor and Ng Suk Lan
Bought by
Ng Yin Dor and Ng Suk Lan
Purchase Details
Closed on
Sep 3, 2002
Sold by
Tom Wilkin and Tom Wilkin W
Bought by
Tom Wilkin
Home Financials for this Owner
Home Financials are based on the most recent Mortgage that was taken out on this home.
Original Mortgage
$1,255,000
Interest Rate
6.37%
Purchase Details
Closed on
Apr 11, 2001
Sold by
Tom Philip and Tom Mary
Bought by
Tom Philip and Tom Mary
Home Financials for this Owner
Home Financials are based on the most recent Mortgage that was taken out on this home.
Original Mortgage
$400,000
Interest Rate
6.98%
Create a Home Valuation Report for This Property
The Home Valuation Report is an in-depth analysis detailing your home's value as well as a comparison with similar homes in the area
Home Values in the Area
Average Home Value in this Area
Purchase History
| Date | Buyer | Sale Price | Title Company |
|---|---|---|---|
| Ng Trust | -- | None Listed On Document | |
| Ng Yin Dor | -- | None Available | |
| Ng Yin Dor | -- | -- | |
| Tom Wilkin | -- | Fidelity National Title Co | |
| Tom Philip | -- | Old Republic Title Company | |
| Tom Philip | $580,000 | Old Republic Title Company |
Source: Public Records
Mortgage History
| Date | Status | Borrower | Loan Amount |
|---|---|---|---|
| Previous Owner | Tom Wilkin | $1,255,000 | |
| Previous Owner | Tom Philip | $400,000 |
Source: Public Records
Tax History Compared to Growth
Tax History
| Year | Tax Paid | Tax Assessment Tax Assessment Total Assessment is a certain percentage of the fair market value that is determined by local assessors to be the total taxable value of land and additions on the property. | Land | Improvement |
|---|---|---|---|---|
| 2025 | $12,203 | $993,822 | $496,911 | $496,911 |
| 2024 | $12,203 | $974,336 | $487,168 | $487,168 |
| 2023 | $12,016 | $955,232 | $477,616 | $477,616 |
| 2022 | $11,781 | $936,502 | $468,251 | $468,251 |
| 2021 | $11,571 | $918,140 | $459,070 | $459,070 |
| 2020 | $11,681 | $908,726 | $454,363 | $454,363 |
| 2019 | $11,234 | $890,908 | $445,454 | $445,454 |
| 2018 | $10,857 | $873,440 | $436,720 | $436,720 |
| 2017 | $10,430 | $856,314 | $428,157 | $428,157 |
| 2016 | $10,252 | $839,524 | $419,762 | $419,762 |
| 2015 | $10,124 | $826,914 | $413,457 | $413,457 |
| 2014 | $9,858 | $810,716 | $405,358 | $405,358 |
Source: Public Records
Map
Nearby Homes
- 1360 9th Ave Unit 7
- 1392 Funston Ave
- 1228 Funston Ave
- 1515 11th Ave
- 1300 7th Ave Unit 1
- 597 Lincoln Way
- 1635 10th Ave Unit 5
- 1349 17th Ave
- 652 Parnassus Ave
- 1346 Judah St
- 1264 3rd Ave
- 1701 Funston Ave Unit 1703
- 1255-1257 19th Ave
- 40 Irving St
- 1483 19th Ave
- 327 Crestmont Dr Unit 329
- 327-329 Crestmont Dr
- 124 Noriega St
- 1233 20th Ave
- 113 193 Warren Dr
- 1333 10th Ave Unit 2
- 1327 10th Ave
- 1325 10th Ave Unit A
- 1325 10th Ave Unit 1
- 1325 10th Ave
- 1343 10th Ave Unit 1345
- 1347 10th Ave Unit 1349
- 1351 10th Ave
- 1326 11th Ave Unit 1328
- 1322 11th Ave
- 1338 11th Ave
- 1322 10th Ave Unit 1326
- 1342 11th Ave Unit B
- 1342 11th Ave Unit 1344
- 1309 10th Ave 901 - 903 Irving St
- 1318 11th Ave
- 1357 10th Ave
- 925 Irving St
- 1338 10th Ave
- 1324 11th Ave