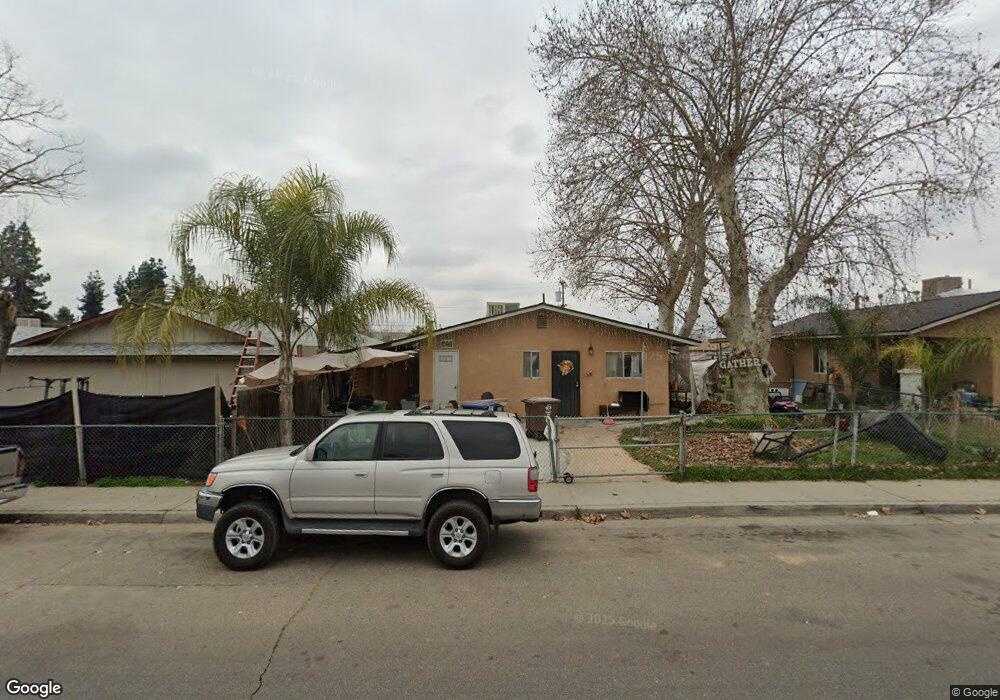
1331 Faller Ave Sanger, CA 93657
Estimated Value: $246,000 - $284,136
3
Beds
1
Bath
1,008
Sq Ft
$264/Sq Ft
Est. Value
About This Home
This home is located at 1331 Faller Ave, Sanger, CA 93657 and is currently estimated at $266,379, approximately $264 per square foot. 1331 Faller Ave is a home located in Fresno County with nearby schools including Jefferson Elementary School, Washington Academic Middle School, and Sanger High School.
Ownership History
Date
Name
Owned For
Owner Type
Purchase Details
Closed on
Jul 28, 2022
Sold by
Eva Franco-Gamez
Bought by
Abundiz Jose Omar and Vera Vanessa Aime
Current Estimated Value
Home Financials for this Owner
Home Financials are based on the most recent Mortgage that was taken out on this home.
Original Mortgage
$237,500
Outstanding Balance
$226,678
Interest Rate
5.3%
Mortgage Type
New Conventional
Estimated Equity
$39,701
Purchase Details
Closed on
Jun 16, 2015
Sold by
Franco Eddie and Franco Emily E
Bought by
Franco Eddie and Zavala Eva Franco
Purchase Details
Closed on
Jul 29, 1994
Sold by
Franco Eddie and Franco Emily E
Bought by
City Of Sanger
Create a Home Valuation Report for This Property
The Home Valuation Report is an in-depth analysis detailing your home's value as well as a comparison with similar homes in the area
Home Values in the Area
Average Home Value in this Area
Purchase History
| Date | Buyer | Sale Price | Title Company |
|---|---|---|---|
| Abundiz Jose Omar | $250,000 | Chicago Title | |
| Franco Eddie | -- | None Available | |
| City Of Sanger | -- | -- |
Source: Public Records
Mortgage History
| Date | Status | Borrower | Loan Amount |
|---|---|---|---|
| Open | Abundiz Jose Omar | $237,500 | |
| Closed | Abundiz Jose Omar | $25,000 |
Source: Public Records
Tax History
| Year | Tax Paid | Tax Assessment Tax Assessment Total Assessment is a certain percentage of the fair market value that is determined by local assessors to be the total taxable value of land and additions on the property. | Land | Improvement |
|---|---|---|---|---|
| 2025 | $3,301 | $260,100 | $52,020 | $208,080 |
| 2023 | $3,091 | $37,424 | $7,479 | $29,945 |
| 2022 | $1,873 | $36,691 | $7,333 | $29,358 |
| 2021 | $1,868 | $35,973 | $7,190 | $28,783 |
| 2020 | $1,856 | $35,605 | $7,117 | $28,488 |
| 2019 | $1,848 | $34,908 | $6,978 | $27,930 |
| 2018 | $353 | $34,225 | $6,842 | $27,383 |
| 2017 | $346 | $33,555 | $6,708 | $26,847 |
| 2016 | $325 | $32,898 | $6,577 | $26,321 |
| 2015 | $326 | $32,405 | $6,479 | $25,926 |
| 2014 | -- | $31,772 | $6,353 | $25,419 |
Source: Public Records
Map
Nearby Homes
Your Personal Tour Guide
Ask me questions while you tour the home.