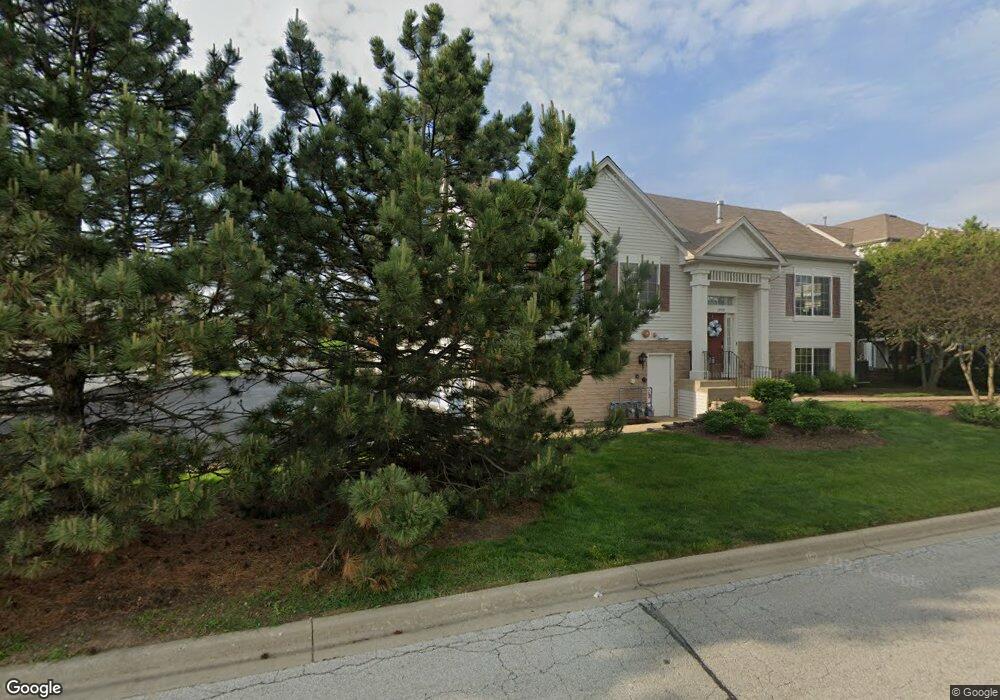
1331 Manning Ave Unit 13-4 Montgomery, IL 60538
Estimated Value: $269,000 - $317,000
2
Beds
3
Baths
1,820
Sq Ft
$163/Sq Ft
Est. Value
About This Home
This home is located at 1331 Manning Ave Unit 13-4, Montgomery, IL 60538 and is currently estimated at $297,123, approximately $163 per square foot. 1331 Manning Ave Unit 13-4 is a home located in Kane County with nearby schools including Nicholson Elementary School, Washington Middle School, and West Aurora High School.
Ownership History
Date
Name
Owned For
Owner Type
Purchase Details
Closed on
May 10, 2018
Sold by
Rosales Mariano L
Bought by
Rivas Soraya A
Current Estimated Value
Home Financials for this Owner
Home Financials are based on the most recent Mortgage that was taken out on this home.
Original Mortgage
$171,830
Outstanding Balance
$149,125
Interest Rate
4.75%
Mortgage Type
FHA
Estimated Equity
$147,998
Purchase Details
Closed on
May 6, 2015
Sold by
Rosales Mariano L and Rosales Leigh A
Bought by
Rosales Mariano L
Home Financials for this Owner
Home Financials are based on the most recent Mortgage that was taken out on this home.
Original Mortgage
$150,350
Interest Rate
3.63%
Mortgage Type
New Conventional
Purchase Details
Closed on
Nov 21, 2007
Sold by
Fieldstone Place Llc
Bought by
Rosales Leigh A and Rosales Mariano L
Home Financials for this Owner
Home Financials are based on the most recent Mortgage that was taken out on this home.
Original Mortgage
$188,385
Interest Rate
6.33%
Mortgage Type
Purchase Money Mortgage
Create a Home Valuation Report for This Property
The Home Valuation Report is an in-depth analysis detailing your home's value as well as a comparison with similar homes in the area
Home Values in the Area
Average Home Value in this Area
Purchase History
| Date | Buyer | Sale Price | Title Company |
|---|---|---|---|
| Rivas Soraya A | $175,000 | First American Title | |
| Rosales Mariano L | -- | Old Republic Natl Title Ins | |
| Rosales Leigh A | $188,500 | Ticor Title Insurance Co |
Source: Public Records
Mortgage History
| Date | Status | Borrower | Loan Amount |
|---|---|---|---|
| Open | Rivas Soraya A | $171,830 | |
| Previous Owner | Rosales Mariano L | $150,350 | |
| Previous Owner | Rosales Leigh A | $188,385 |
Source: Public Records
Tax History Compared to Growth
Tax History
| Year | Tax Paid | Tax Assessment Tax Assessment Total Assessment is a certain percentage of the fair market value that is determined by local assessors to be the total taxable value of land and additions on the property. | Land | Improvement |
|---|---|---|---|---|
| 2024 | $5,202 | $72,018 | $5,302 | $66,716 |
| 2023 | $5,028 | $64,347 | $4,737 | $59,610 |
| 2022 | $4,747 | $58,711 | $4,322 | $54,389 |
| 2021 | $5,200 | $62,434 | $4,024 | $58,410 |
| 2020 | $5,310 | $62,294 | $3,738 | $58,556 |
| 2019 | $5,405 | $60,162 | $3,463 | $56,699 |
| 2018 | $5,013 | $54,234 | $3,203 | $51,031 |
| 2017 | $4,896 | $51,119 | $2,951 | $48,168 |
| 2016 | $4,677 | $46,989 | $2,530 | $44,459 |
| 2015 | $3,955 | $43,775 | $2,176 | $41,599 |
| 2014 | $3,955 | $42,168 | $2,159 | $40,009 |
| 2013 | $3,955 | $41,502 | $2,063 | $39,439 |
Source: Public Records
Map
Nearby Homes
- 1375 Manning Ave
- 1405 Manning Ave
- 1422 Manning Ave
- 1440 Manning Ave
- 1707 Deer Run Dr
- 1342 Oak Ridge Ln
- 106 Hamlet Cir
- 170 Montgomery Rd
- 1336 Douglas Ave Unit 13
- 37 Fallcreek Cir
- 36 Fallcreek Cir Unit 35
- 101 Red Fox Run
- 75 Briarcliff Rd
- 124 Heathgate Rd
- 114 Heathgate Rd
- 136 Heathgate Rd
- 0 N River St
- 106 Braeburn Rd
- Lot 1 Douglas Ave
- 22 Marnel Rd
- 1331 Manning Ave
- 1333 Manning Ave
- 1325 Manning Ave
- 1335 Manning Ave
- 1323 Manning Ave
- 1337 Manning Ave
- 1361 Manning Ave
- 1361 Manning Ave Unit 1361
- 1361 Manning Ave Unit 15-1
- 1363 Manning Ave
- 1363 Manning Ave Unit 15-2
- 1321 Manning Ave
- 1305 Manning Ave
- 1357 Manning Ave Unit 14-4
- 1357 Manning Ave
- 1303 Manning Ave
- 1307 Manning Ave
- 1301 Manning Ave
- 1367 Manning Ave