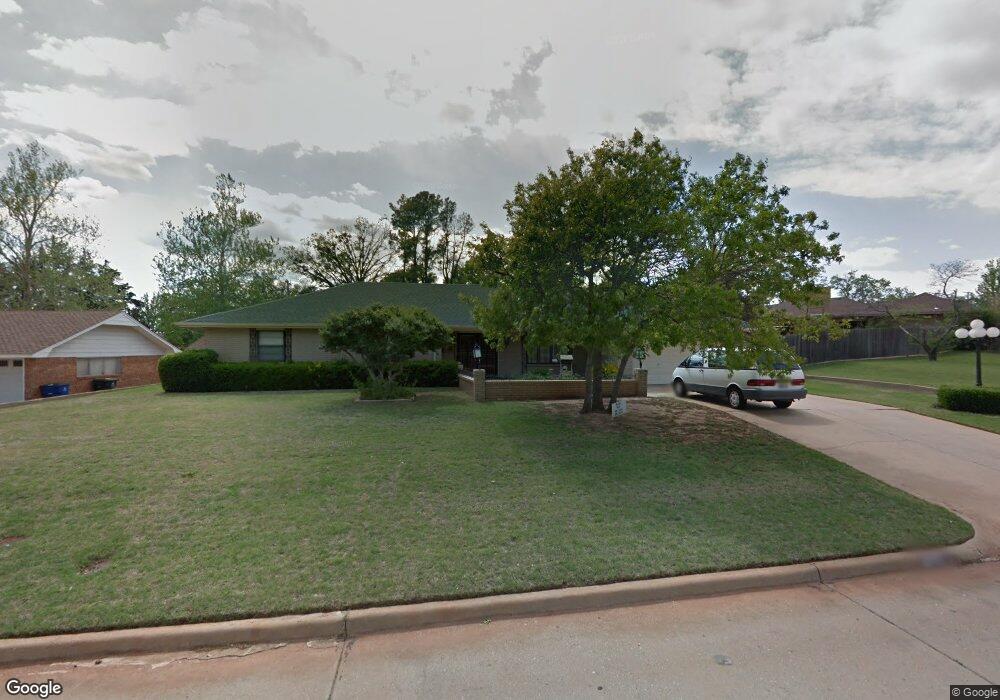
1331 Normandy Rd Duncan, OK 73533
Estimated Value: $225,950 - $295,000
4
Beds
3
Baths
2,408
Sq Ft
$108/Sq Ft
Est. Value
About This Home
This home is located at 1331 Normandy Rd, Duncan, OK 73533 and is currently estimated at $260,738, approximately $108 per square foot. 1331 Normandy Rd is a home located in Stephens County with nearby schools including Emerson Elementary School, Duncan Middle School, and Duncan High School.
Ownership History
Date
Name
Owned For
Owner Type
Purchase Details
Closed on
May 4, 2017
Sold by
Fish Dearl G and Fish Phyllis R
Bought by
Fish Dearl G and Fish Phyllis R
Current Estimated Value
Purchase Details
Closed on
Mar 18, 2016
Sold by
Nguyen Thanh Thuy T
Bought by
Fish Dearl G and Fish Phyllis R
Home Financials for this Owner
Home Financials are based on the most recent Mortgage that was taken out on this home.
Original Mortgage
$165,466
Interest Rate
3.72%
Mortgage Type
Commercial
Purchase Details
Closed on
Jul 25, 2005
Sold by
Beny Mark R and Beny Kathy
Bought by
Pham Phan and Nguyen Thanh Thuy T
Home Financials for this Owner
Home Financials are based on the most recent Mortgage that was taken out on this home.
Original Mortgage
$120,000
Interest Rate
6%
Mortgage Type
Purchase Money Mortgage
Purchase Details
Closed on
Jun 29, 2001
Sold by
Vorse Thomas G and Vorse Glenda
Purchase Details
Closed on
May 17, 1999
Sold by
Boice Raymond E and Boice Orothy
Purchase Details
Closed on
Aug 28, 1992
Sold by
Eden Eden F and Eden Wayne
Create a Home Valuation Report for This Property
The Home Valuation Report is an in-depth analysis detailing your home's value as well as a comparison with similar homes in the area
Purchase History
| Date | Buyer | Sale Price | Title Company |
|---|---|---|---|
| Fish Dearl G | -- | None Available | |
| Fish Dearl G | $165,000 | None Available | |
| Pham Phan | $150,000 | None Available | |
| -- | $145,000 | -- | |
| -- | $135,000 | -- | |
| -- | $110,000 | -- |
Source: Public Records
Mortgage History
| Date | Status | Borrower | Loan Amount |
|---|---|---|---|
| Closed | Fish Dearl G | $165,466 | |
| Previous Owner | Pham Phan | $120,000 |
Source: Public Records
Tax History
| Year | Tax Paid | Tax Assessment Tax Assessment Total Assessment is a certain percentage of the fair market value that is determined by local assessors to be the total taxable value of land and additions on the property. | Land | Improvement |
|---|---|---|---|---|
| 2025 | $1,551 | $19,392 | $1,398 | $17,994 |
| 2024 | $1,472 | $18,278 | $1,398 | $16,880 |
| 2023 | $1,472 | $18,279 | $1,398 | $16,881 |
| 2022 | $1,380 | $17,746 | $1,398 | $16,348 |
| 2021 | $1,339 | $16,728 | $1,398 | $15,330 |
| 2020 | $1,408 | $17,305 | $1,398 | $15,907 |
| 2019 | $1,367 | $16,801 | $1,398 | $15,403 |
| 2018 | $1,407 | $16,801 | $1,398 | $15,403 |
| 2017 | $1,543 | $18,960 | $1,398 | $17,562 |
| 2016 | $1,323 | $15,559 | $1,398 | $14,161 |
| 2015 | $1,273 | $15,559 | $1,398 | $14,161 |
| 2014 | $1,273 | $15,559 | $1,398 | $14,161 |
Source: Public Records
Map
Nearby Homes
- 1312 Mccasland Pkwy
- 1423 N 7th St
- 907 Hillcrest Dr
- 1001 W Jones Ave
- 1506 Crescent Dr
- 1216 N 8th St
- 1125 Peck Ave
- 1606 Indian Terrace
- 1110 Crescent Dr
- 1205 N 11th St
- 1202 N 12th St
- 1061 N 8th St
- 1706 Northridge Dr
- 1112 N 12th St
- 1112 N 4th St
- 1449 W Will Rogers Dr
- 1405 Evergreen Dr
- 1309 W Spruce Ave
- 905 W Pine Ave
- 1108 Rock Springs Cir
- 1329 Normandy Rd
- 1320 Mccasland Pkwy
- 1318 Mccasland Pkwy
- 1330 Normandy Rd
- 1327 Normandy Rd
- 1332 Normandy Rd
- 1328 Normandy Rd
- 1334 Normandy Rd
- 1316 Mccasland Pkwy
- 1336 Normandy Rd
- 1325 Normandy Rd
- 1326 Normandy Rd
- 1405 N 7th St
- 1407 N 7th St
- 1403 N 7th St
- 1409 N 7th St
- 1401 N 7th St
- 2525 N 7th St
- 902 Hillcrest St
- 1411 N 7th St
Your Personal Tour Guide
Ask me questions while you tour the home.