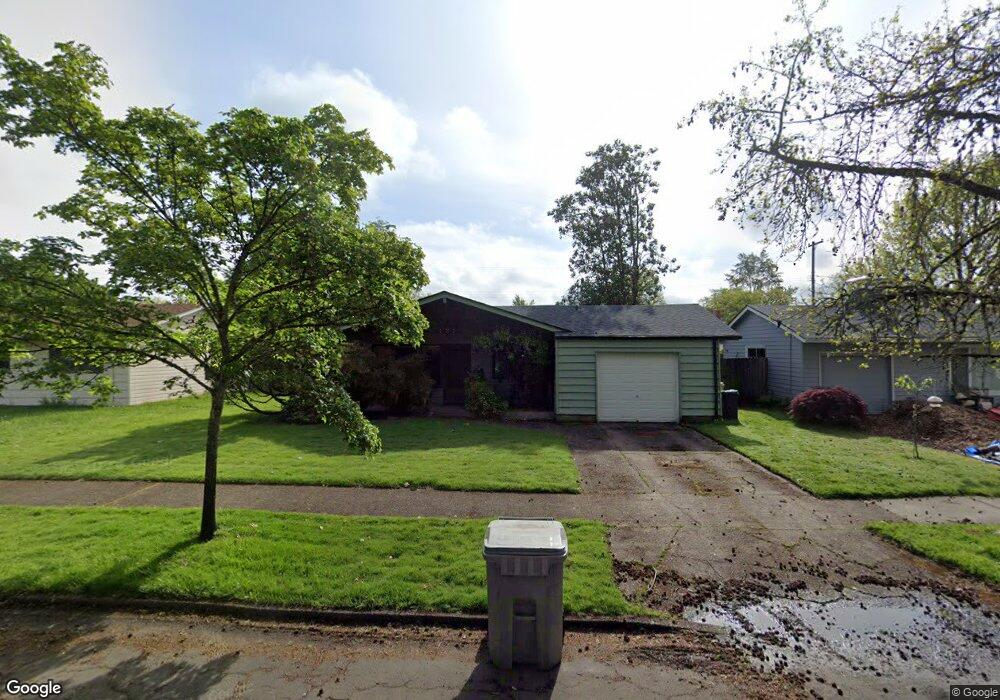
1331 NW 12th St Corvallis, OR 97330
Northwest Corvallis NeighborhoodEstimated Value: $383,000 - $423,557
3
Beds
1
Bath
912
Sq Ft
$440/Sq Ft
Est. Value
About This Home
This home is located at 1331 NW 12th St, Corvallis, OR 97330 and is currently estimated at $400,889, approximately $439 per square foot. 1331 NW 12th St is a home located in Benton County with nearby schools including Garfield Elementary School, Linus Pauling Middle School, and Corvallis High School.
Ownership History
Date
Name
Owned For
Owner Type
Purchase Details
Closed on
Mar 7, 2008
Sold by
Archambault Alcyon
Bought by
Christiansen Kelly R
Current Estimated Value
Home Financials for this Owner
Home Financials are based on the most recent Mortgage that was taken out on this home.
Original Mortgage
$132,000
Outstanding Balance
$25,238
Interest Rate
5.41%
Mortgage Type
Seller Take Back
Estimated Equity
$375,651
Purchase Details
Closed on
Jun 11, 2004
Sold by
Kiel Eugene D
Bought by
Archambault Alcyon
Purchase Details
Closed on
Aug 4, 2003
Sold by
Cederquist Morris A and Cederquist Alma J
Bought by
Kiel Eugene D and Kiel Carlene M
Purchase Details
Closed on
Apr 25, 2003
Sold by
Investors Mortgage Co
Bought by
Cederquist Morris A and Cederquist Alma J
Purchase Details
Closed on
Apr 16, 2003
Sold by
Pointer Fred C and Pointer Mary A
Bought by
Investors Mortgage Co
Purchase Details
Closed on
Jun 18, 2001
Sold by
Kiel Eugene D and Kiel Carlene M
Bought by
Kiel Eugene D
Create a Home Valuation Report for This Property
The Home Valuation Report is an in-depth analysis detailing your home's value as well as a comparison with similar homes in the area
Home Values in the Area
Average Home Value in this Area
Purchase History
| Date | Buyer | Sale Price | Title Company |
|---|---|---|---|
| Christiansen Kelly R | $158,000 | Lawyers Title Insurance Corp | |
| Archambault Alcyon | $154,900 | Fidelity Natl Title Co Of Or | |
| Kiel Eugene D | $43,000 | Fidelity National Title | |
| Cederquist Morris A | $13,884 | -- | |
| Investors Mortgage Co | $12,500 | First American Title | |
| Kiel Eugene D | -- | -- |
Source: Public Records
Mortgage History
| Date | Status | Borrower | Loan Amount |
|---|---|---|---|
| Open | Christiansen Kelly R | $132,000 |
Source: Public Records
Tax History Compared to Growth
Tax History
| Year | Tax Paid | Tax Assessment Tax Assessment Total Assessment is a certain percentage of the fair market value that is determined by local assessors to be the total taxable value of land and additions on the property. | Land | Improvement |
|---|---|---|---|---|
| 2024 | $3,509 | $182,680 | -- | -- |
| 2023 | $3,304 | $177,359 | $0 | $0 |
| 2022 | $3,208 | $172,193 | $0 | $0 |
| 2021 | $3,102 | $167,178 | $0 | $0 |
| 2020 | $3,085 | $162,309 | $0 | $0 |
| 2019 | $2,843 | $157,582 | $0 | $0 |
| 2018 | $2,858 | $152,992 | $0 | $0 |
| 2017 | $2,644 | $148,536 | $0 | $0 |
| 2016 | $2,633 | $144,210 | $0 | $0 |
| 2015 | $2,577 | $140,010 | $0 | $0 |
| 2014 | $2,511 | $135,932 | $0 | $0 |
| 2012 | -- | $128,129 | $0 | $0 |
Source: Public Records
Map
Nearby Homes
- 1355 NW 11th St
- 1100 NW Dixon St
- 1430 NW 15th St
- 1225 NW 18th St
- 1720 NW Division St
- 1919 NW Buchanan Ave
- 1615 NW Arthur Cir
- 620 NW 19th St
- 2005 NW Taylor Ave
- 1925 NW 14th St
- 1230 NW 23rd St
- 2125 NW Highland Dr
- 216 NW 13th St
- 223 NW 15th St
- 3913 NW Goldfinch Dr
- 3923 NW Goldfinch Dr
- 3933 NW Goldfinch Dr
- 3945 NW Goldfinch Dr
- 3700 NW Goldfinch Dr
- 3753 NW Goldfinch Dr
- 1327 NW 12th St
- 1333 NW 12th St
- 1330 NW 11th St
- 1323 NW 12th St
- 1341 NW 12th St
- 1320 NW 11th St
- 1340 NW 11th St
- 1350 NW 11th St
- 1310 NW 11th St
- 1328 NW 12th St
- 1330 NW 12th St
- 1301 NW 12th St
- 1326 NW 12th St
- 1344 NW 12th St
- 1320 NW 12th St
- 1110 NW Grant Ave
- 1300 NW 11th St
- 1208 NW Grant Ave
- 1300 NW 12th St
- 1325 NW 11th St