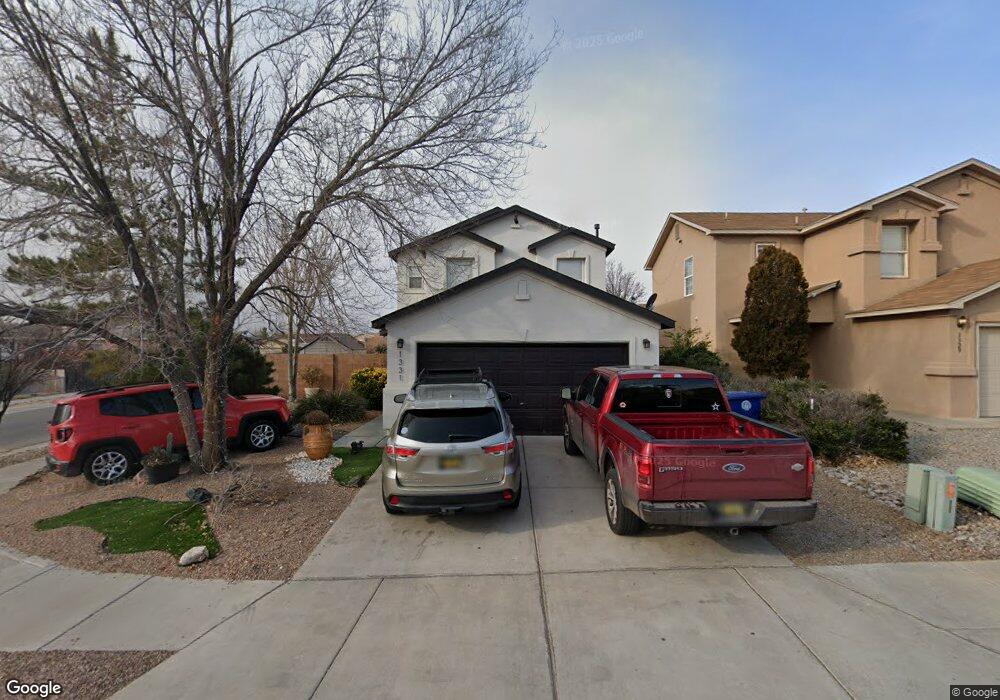
1331 Ojo Sarco St SW Albuquerque, NM 87121
Southwest Heights NeighborhoodEstimated Value: $294,000 - $308,000
3
Beds
2
Baths
1,768
Sq Ft
$169/Sq Ft
Est. Value
About This Home
This home is located at 1331 Ojo Sarco St SW, Albuquerque, NM 87121 and is currently estimated at $299,342, approximately $169 per square foot. 1331 Ojo Sarco St SW is a home located in Bernalillo County with nearby schools including Maryann Binford Elementary School, Truman Middle School, and Rio Grande High School.
Ownership History
Date
Name
Owned For
Owner Type
Purchase Details
Closed on
May 13, 2025
Sold by
Desantiago Angelios and Desantiago Jesus A
Bought by
Desantiago Jesus A and De Santiago Angelica
Current Estimated Value
Home Financials for this Owner
Home Financials are based on the most recent Mortgage that was taken out on this home.
Original Mortgage
$150,000
Outstanding Balance
$149,468
Interest Rate
6.64%
Mortgage Type
New Conventional
Estimated Equity
$149,874
Purchase Details
Closed on
Sep 19, 2008
Sold by
Desantiago Jesus A
Bought by
Desantiago Jesus A and Desantiago Angelica
Purchase Details
Closed on
Aug 21, 2000
Sold by
Kaufman & Broad Home Sales Of Nm Inc
Bought by
Desantiago Jesus A
Home Financials for this Owner
Home Financials are based on the most recent Mortgage that was taken out on this home.
Original Mortgage
$98,443
Interest Rate
8.22%
Mortgage Type
FHA
Create a Home Valuation Report for This Property
The Home Valuation Report is an in-depth analysis detailing your home's value as well as a comparison with similar homes in the area
Home Values in the Area
Average Home Value in this Area
Purchase History
| Date | Buyer | Sale Price | Title Company |
|---|---|---|---|
| Desantiago Jesus A | -- | Titlemax | |
| Desantiago Jesus A | -- | Rio Grande Title Company Inc | |
| Desantiago Jesus A | -- | First American Title Co |
Source: Public Records
Mortgage History
| Date | Status | Borrower | Loan Amount |
|---|---|---|---|
| Open | Desantiago Jesus A | $150,000 | |
| Previous Owner | Desantiago Jesus A | $98,443 |
Source: Public Records
Tax History Compared to Growth
Tax History
| Year | Tax Paid | Tax Assessment Tax Assessment Total Assessment is a certain percentage of the fair market value that is determined by local assessors to be the total taxable value of land and additions on the property. | Land | Improvement |
|---|---|---|---|---|
| 2024 | $1,856 | $43,992 | $11,230 | $32,762 |
| 2023 | $1,825 | $42,711 | $10,903 | $31,808 |
| 2022 | $1,764 | $41,467 | $10,585 | $30,882 |
| 2021 | $1,705 | $40,260 | $10,277 | $29,983 |
| 2020 | $1,677 | $39,087 | $9,978 | $29,109 |
| 2019 | $1,627 | $37,949 | $9,687 | $28,262 |
| 2018 | $1,570 | $37,949 | $9,687 | $28,262 |
| 2017 | $1,521 | $36,844 | $9,405 | $27,439 |
| 2016 | $1,478 | $34,730 | $8,866 | $25,864 |
| 2015 | $34,730 | $34,730 | $8,866 | $25,864 |
| 2014 | $1,487 | $35,030 | $8,866 | $26,164 |
| 2013 | -- | $35,030 | $8,866 | $26,164 |
Source: Public Records
Map
Nearby Homes
- 1615 Quiet Desert Dr SW
- 0 Sage Rd SW Unit 1085259
- 780 Jaconita Place SW
- 0 Nwq Unser and Sage SW Unit 1081546
- 7304 Autumn Sky Rd SW
- 1815 Shadetree Dr SW
- Clove Plan at Sage Park
- Cumin Plan at Sage Park
- Nutmeg Plan at Sage Park
- Basil Plan at Sage Park
- Turmeric Plan at Sage Park
- Bay Leaf Plan at Sage Park
- 1420 Summerfield Place SW
- 0 Nna Unser&tower SW Unit 1081416
- 7814 Desert Canyon Place SW
- 8209 Bianca Ct SW
- 1116 Santander St SW
- 921 Roma Dora Ln
- 3525 Tower Rd SW
- 2901 Amalia Rd SW
- 1329 Ojo Sarco St SW
- 1328 Secret Valley Dr SW
- 1327 Ojo Sarco St SW
- 1335 Ojo Sarco St SW
- 1324 Secret Valley Dr SW
- 1337 Ojo Sarco St SW
- 1400 Secret Valley Dr SW
- 1320 Secret Valley Dr SW
- 1330 Ojo Sarco St SW
- 1334 Ojo Sarco St SW
- 1332 Ojo Sarco St SW
- 1323 Ojo Sarco St SW
- 1328 Ojo Sarco St SW
- 1339 Ojo Sarco St SW
- 1336 Ojo Sarco St SW
- 1404 Secret Valley Dr SW
- 1404 Secret Valley Dr SW
- 1338 Ojo Sarco St SW Unit 1
- 1321 Ojo Sarco St SW
- 1341 Ojo Sarco St SW Unit 1