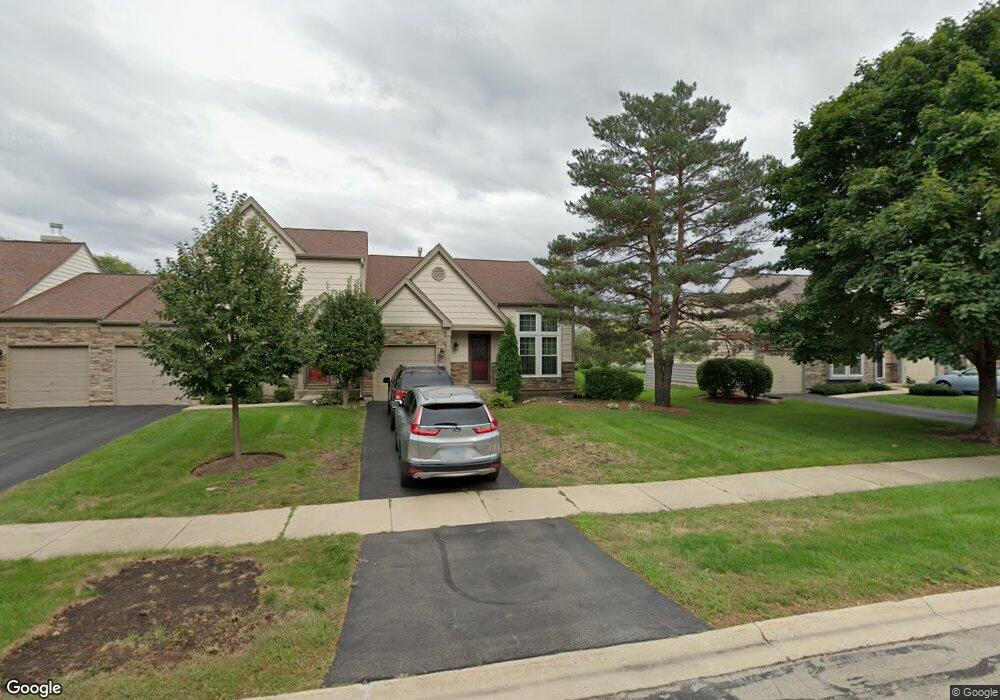
1331 Seabury Cir Carol Stream, IL 60188
Estimated Value: $318,000 - $341,000
2
Beds
2
Baths
1,340
Sq Ft
$245/Sq Ft
Est. Value
About This Home
This home is located at 1331 Seabury Cir, Carol Stream, IL 60188 and is currently estimated at $327,861, approximately $244 per square foot. 1331 Seabury Cir is a home located in DuPage County with nearby schools including Spring Trail Elementary School, Eastview Middle School, and Bartlett High School.
Ownership History
Date
Name
Owned For
Owner Type
Purchase Details
Closed on
Aug 30, 2002
Sold by
Zarlenga Robert W and Zarlenga Joanne P
Bought by
Gor Subhash and Gor Niru
Current Estimated Value
Home Financials for this Owner
Home Financials are based on the most recent Mortgage that was taken out on this home.
Original Mortgage
$143,200
Interest Rate
5.64%
Purchase Details
Closed on
May 20, 1994
Sold by
Petersen Timothy C and Petersen Catherine A
Bought by
Zarlenga Robert W and Zarlenga Joanne P
Home Financials for this Owner
Home Financials are based on the most recent Mortgage that was taken out on this home.
Original Mortgage
$97,000
Interest Rate
5.75%
Create a Home Valuation Report for This Property
The Home Valuation Report is an in-depth analysis detailing your home's value as well as a comparison with similar homes in the area
Home Values in the Area
Average Home Value in this Area
Purchase History
| Date | Buyer | Sale Price | Title Company |
|---|---|---|---|
| Gor Subhash | $179,000 | -- | |
| Zarlenga Robert W | $127,000 | Attorneys Title Guaranty Fun |
Source: Public Records
Mortgage History
| Date | Status | Borrower | Loan Amount |
|---|---|---|---|
| Previous Owner | Gor Subhash | $143,200 | |
| Previous Owner | Zarlenga Robert W | $97,000 |
Source: Public Records
Tax History Compared to Growth
Tax History
| Year | Tax Paid | Tax Assessment Tax Assessment Total Assessment is a certain percentage of the fair market value that is determined by local assessors to be the total taxable value of land and additions on the property. | Land | Improvement |
|---|---|---|---|---|
| 2024 | $5,403 | $86,479 | $13,921 | $72,558 |
| 2023 | $4,891 | $78,460 | $12,630 | $65,830 |
| 2022 | $3,435 | $71,140 | $11,450 | $59,690 |
| 2021 | $3,508 | $67,530 | $10,870 | $56,660 |
| 2020 | $3,520 | $65,500 | $10,540 | $54,960 |
| 2019 | $3,607 | $63,160 | $10,160 | $53,000 |
| 2018 | $3,601 | $60,440 | $9,720 | $50,720 |
| 2017 | $3,687 | $58,030 | $9,330 | $48,700 |
| 2016 | $4,078 | $55,430 | $8,910 | $46,520 |
| 2015 | $4,072 | $52,470 | $8,430 | $44,040 |
| 2014 | $3,919 | $52,720 | $8,470 | $44,250 |
| 2013 | $5,233 | $53,980 | $8,670 | $45,310 |
Source: Public Records
Map
Nearby Homes
- 1297 Woodlake Dr Unit 1
- 1050 Rockport Dr Unit 233
- 1309 Coldspring Rd Unit 162
- 1063 Parkview Cir
- 1318 Antigo Trail
- 1925 Grosse Pointe Ct
- 1885 Grosse Pointe Ct
- 1402 Walnut Cir Unit 6
- 457 Hadley Ct
- 1410 Georgetown Dr
- 2315 Stepstone Ln
- 1824 Isle Royal Ln
- 371 Ashford Cir Unit 4
- 2363 Cove Dr
- 342 Ashford Cir Unit 2
- 754 Huntington Dr
- 2320 Bayside Dr
- 1803 Rizzi Ln
- 647 Kingsbridge Dr
- 1390 Merrimac Ln N
- 1335 Seabury Cir
- 1325 Seabury Cir
- 1339 Seabury Cir Unit 1
- 1323 Seabury Cir
- 1098 Ridgefield Cir
- 1341 Seabury Cir
- 1096 Ridgefield Cir
- 1094 Ridgefield Cir
- 1343 Seabury Cir Unit 1
- 1334 Ridgefield Cir Unit 1
- 1317 Seabury Cir Unit 1
- 1092 Ridgefield Cir Unit 1092
- 1336 Ridgefield Cir
- 1340 Gloucester Cir
- 1315 Seabury Cir
- 1347 Seabury Cir
- 1320 Seabury Cir
- 1338 Ridgefield Cir
- 1318 Seabury Cir
- 1313 Seabury Cir