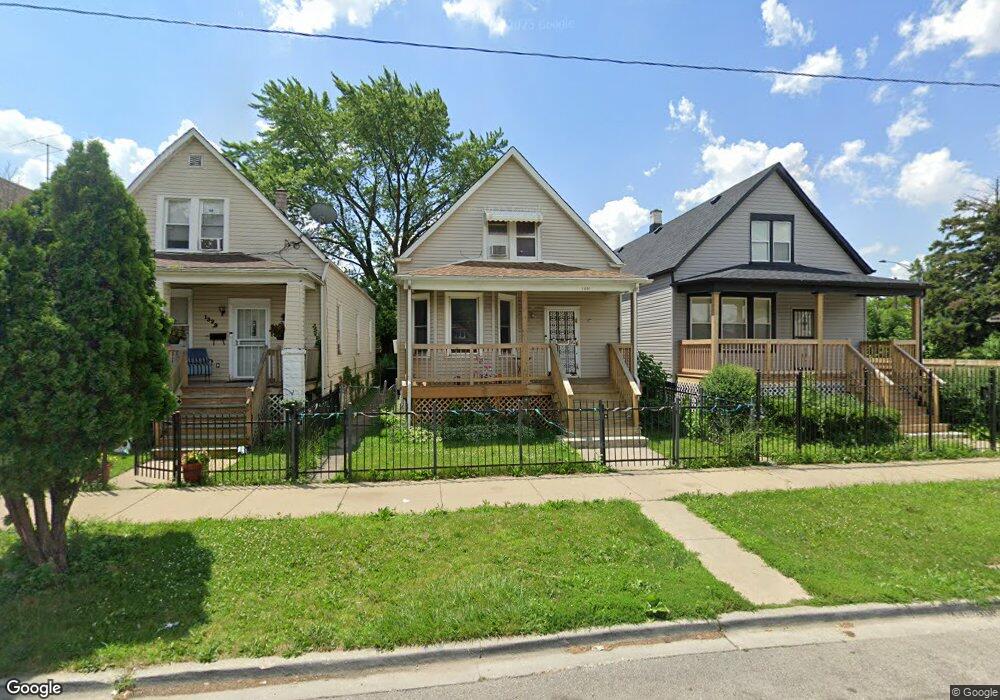
1331 W 72nd St Chicago, IL 60636
Englewood NeighborhoodEstimated Value: $90,651 - $168,000
3
Beds
1
Bath
1,152
Sq Ft
$119/Sq Ft
Est. Value
About This Home
This home is located at 1331 W 72nd St, Chicago, IL 60636 and is currently estimated at $137,663, approximately $119 per square foot. 1331 W 72nd St is a home located in Cook County with nearby schools including Wentworth Elementary School, The Montessori School of Englewood Charter School, and St Sabina Academy.
Ownership History
Date
Name
Owned For
Owner Type
Purchase Details
Closed on
Apr 21, 2010
Sold by
Nunnally Willie
Bought by
Nunnally Willie and Harris Joy
Current Estimated Value
Purchase Details
Closed on
Oct 29, 2001
Sold by
Harris Trust & Svgs Bank
Bought by
Nunnally Willie
Home Financials for this Owner
Home Financials are based on the most recent Mortgage that was taken out on this home.
Original Mortgage
$74,050
Outstanding Balance
$28,878
Interest Rate
6.69%
Mortgage Type
FHA
Estimated Equity
$108,785
Purchase Details
Closed on
Jun 11, 2001
Sold by
The Provident Bank
Bought by
Harris Trust & Svgs Bank and Trust #4010
Home Financials for this Owner
Home Financials are based on the most recent Mortgage that was taken out on this home.
Original Mortgage
$46,000
Interest Rate
7.18%
Mortgage Type
Purchase Money Mortgage
Create a Home Valuation Report for This Property
The Home Valuation Report is an in-depth analysis detailing your home's value as well as a comparison with similar homes in the area
Home Values in the Area
Average Home Value in this Area
Purchase History
| Date | Buyer | Sale Price | Title Company |
|---|---|---|---|
| Nunnally Willie | -- | Chicago Title Insurance Co | |
| Nunnally Willie | $75,000 | First American Title | |
| Harris Trust & Svgs Bank | $19,000 | -- |
Source: Public Records
Mortgage History
| Date | Status | Borrower | Loan Amount |
|---|---|---|---|
| Open | Nunnally Willie | $74,050 | |
| Previous Owner | Harris Trust & Svgs Bank | $46,000 |
Source: Public Records
Tax History Compared to Growth
Tax History
| Year | Tax Paid | Tax Assessment Tax Assessment Total Assessment is a certain percentage of the fair market value that is determined by local assessors to be the total taxable value of land and additions on the property. | Land | Improvement |
|---|---|---|---|---|
| 2024 | $38 | $4,501 | $1,088 | $3,413 |
| 2023 | $16 | $3,500 | $1,890 | $1,610 |
| 2022 | $16 | $3,500 | $1,890 | $1,610 |
| 2021 | $33 | $3,497 | $1,888 | $1,609 |
| 2020 | $669 | $6,106 | $2,718 | $3,388 |
| 2019 | $674 | $6,785 | $2,718 | $4,067 |
| 2018 | $662 | $6,785 | $2,718 | $4,067 |
| 2017 | $1,029 | $8,157 | $2,356 | $5,801 |
| 2016 | $1,134 | $8,157 | $2,356 | $5,801 |
| 2015 | $1,014 | $8,157 | $2,356 | $5,801 |
| 2014 | $1,441 | $7,767 | $2,175 | $5,592 |
| 2013 | $1,413 | $7,767 | $2,175 | $5,592 |
Source: Public Records
Map
Nearby Homes
- 7050 S Throop St
- 1241 W 72nd Place
- 1445 W 73rd St
- 1500 W 71st St
- 7041 S Throop St
- 1508 W 72nd St
- 1467 W 73rd St
- 7019 S Throop St
- 7022 S Elizabeth St
- 6953 S Loomis Blvd
- 6952 S Ada St
- 7042 S Racine Ave
- 7300 S Racine Ave
- 6946 S Loomis Blvd
- 7144 S May St
- 6943 S Ada St
- 6939 S Ada St
- 7238 S May St
- 6929 S Loomis Blvd
- 6953 S Elizabeth St
- 1329 W 72nd St
- 1333 W 72nd St
- 1325 W 72nd St
- 1335 W 72nd St
- 1335 W 72nd St
- 1321 W 72nd St
- 1319 W 72nd St
- 1330 W 72nd Place
- 1326 W 72nd Place
- 1332 W 72nd Place
- 1317 W 72nd St
- 1324 W 72nd Place
- 1336 W 72nd Place
- 1401 W 72nd St
- 1313 W 72nd St
- 1318 W 72nd Place
- 1405 W 72nd St
- 1330 W 72nd St
- 1328 W 72nd St
- 1326 W 72nd St