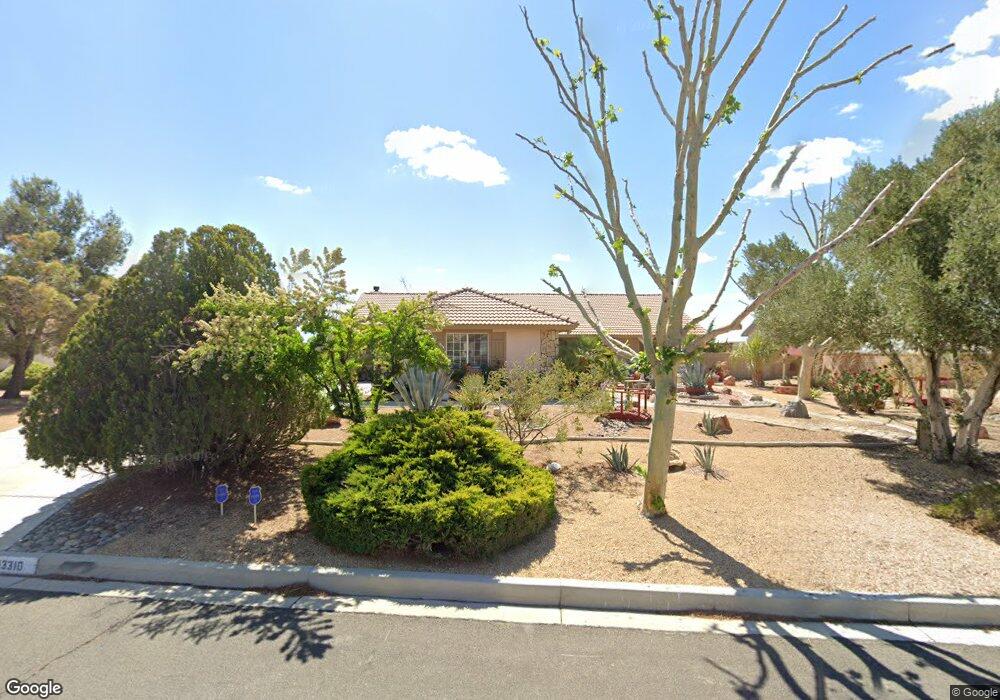
13310 Paraiso Rd Apple Valley, CA 92308
High Desert NeighborhoodEstimated Value: $492,808 - $625,000
3
Beds
2
Baths
2,394
Sq Ft
$232/Sq Ft
Est. Value
About This Home
This home is located at 13310 Paraiso Rd, Apple Valley, CA 92308 and is currently estimated at $554,452, approximately $231 per square foot. 13310 Paraiso Rd is a home located in San Bernardino County with nearby schools including Sitting Bull Academy, Apple Valley High School, and Excelsior Charter School.
Ownership History
Date
Name
Owned For
Owner Type
Purchase Details
Closed on
Oct 26, 2012
Sold by
Peter Jerry A and Peter Gloria E
Bought by
Peter Jerry A and Peter Gloria E
Current Estimated Value
Home Financials for this Owner
Home Financials are based on the most recent Mortgage that was taken out on this home.
Original Mortgage
$161,000
Outstanding Balance
$111,096
Interest Rate
3.36%
Mortgage Type
New Conventional
Estimated Equity
$443,356
Purchase Details
Closed on
Aug 14, 2004
Sold by
Peter Jerry A and Peter Gloria E
Bought by
Peter Jerry A and Peter Gloria E
Purchase Details
Closed on
Jul 1, 1998
Sold by
Clearview Llc
Bought by
Peter Jerry A and Peter Gloria E
Home Financials for this Owner
Home Financials are based on the most recent Mortgage that was taken out on this home.
Original Mortgage
$150,512
Interest Rate
6.6%
Mortgage Type
FHA
Create a Home Valuation Report for This Property
The Home Valuation Report is an in-depth analysis detailing your home's value as well as a comparison with similar homes in the area
Home Values in the Area
Average Home Value in this Area
Purchase History
| Date | Buyer | Sale Price | Title Company |
|---|---|---|---|
| Peter Jerry A | -- | Act | |
| Peter Jerry A | -- | -- | |
| Peter Jerry A | $154,000 | Chicago Title Co |
Source: Public Records
Mortgage History
| Date | Status | Borrower | Loan Amount |
|---|---|---|---|
| Open | Peter Jerry A | $161,000 | |
| Previous Owner | Peter Jerry A | $150,512 |
Source: Public Records
Tax History Compared to Growth
Tax History
| Year | Tax Paid | Tax Assessment Tax Assessment Total Assessment is a certain percentage of the fair market value that is determined by local assessors to be the total taxable value of land and additions on the property. | Land | Improvement |
|---|---|---|---|---|
| 2025 | $2,862 | $241,255 | $60,357 | $180,898 |
| 2024 | $2,862 | $236,525 | $59,174 | $177,351 |
| 2023 | $2,836 | $231,888 | $58,014 | $173,874 |
| 2022 | $2,793 | $227,341 | $56,876 | $170,465 |
| 2021 | $2,732 | $222,884 | $55,761 | $167,123 |
| 2020 | $2,700 | $220,598 | $55,189 | $165,409 |
| 2019 | $2,651 | $216,273 | $54,107 | $162,166 |
| 2018 | $2,588 | $212,032 | $53,046 | $158,986 |
| 2017 | $2,553 | $207,875 | $52,006 | $155,869 |
| 2016 | $2,452 | $203,799 | $50,986 | $152,813 |
| 2015 | $2,418 | $200,738 | $50,220 | $150,518 |
| 2014 | $2,385 | $196,806 | $49,236 | $147,570 |
Source: Public Records
Map
Nearby Homes
- 13240 Mugu Ct
- 13335 Paoha Rd
- 13288 Choco Rd
- 13195 Trailwood Way
- 13114 Choco Rd
- 12982 Topsham Bay
- 19274 Kanbridge St
- 12971 Lompoc Rd
- 19220 Monterey St
- 13434 Sunset Dr
- 12916 Hyperion Ln
- 13262 Cuyamaca Rd
- 19809 Modoc Rd
- 19135 Monterey St
- 13724 Chateau Ct
- 12809 Yorkshire Dr
- 13411 Ivanpah Rd
- 23766 Valley View Ct
- 13771 Wawona Rd
- 19824 Yucca Loma Rd
- 13290 Paraiso Rd
- 13330 Paraiso Rd
- 13270 Paraiso Rd
- 13311 Paraiso Rd
- 13321 Paraiso Rd
- 13291 Paraiso Rd
- 13340 Paraiso Rd
- 13335 Paraiso Rd
- 13271 Paraiso Rd
- 13250 Paraiso Rd
- 13351 Paraiso Rd
- 13251 Paraiso Rd
- 13360 Paraiso Rd
- 13230 Paraiso Rd
- 13375 Paraiso Rd
- 13231 Paraiso Rd
- 13380 Paraiso Rd
- 13222 Paraiso Rd
- 13410 Paraiso Rd
- 13211 Paraiso Rd