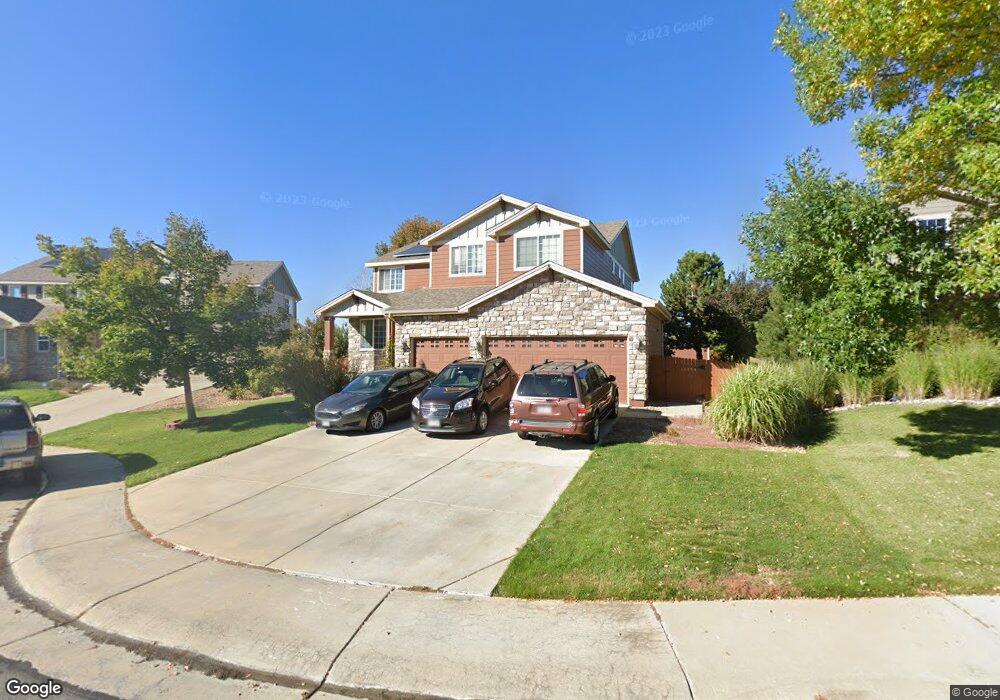
13311 Ivy St Thornton, CO 80602
Estimated Value: $673,236 - $731,000
4
Beds
4
Baths
4,060
Sq Ft
$174/Sq Ft
Est. Value
About This Home
This home is located at 13311 Ivy St, Thornton, CO 80602 and is currently estimated at $706,559, approximately $174 per square foot. 13311 Ivy St is a home located in Adams County with nearby schools including West Ridge Elementary School, Shore Acres Elementary School, and Elderberry Elementary.
Ownership History
Date
Name
Owned For
Owner Type
Purchase Details
Closed on
Jan 11, 2021
Sold by
To Diana and Estate Of Son T N Cao
Bought by
Anello Mark and Echeverria Anello Laura
Current Estimated Value
Purchase Details
Closed on
Jun 28, 2019
Sold by
To Diana H M
Bought by
Anello Mark and Echeverria Anello Laura
Purchase Details
Closed on
May 24, 2012
Sold by
To Mary and To Diana H M
Bought by
To Diana H M and Cao Son T N
Home Financials for this Owner
Home Financials are based on the most recent Mortgage that was taken out on this home.
Original Mortgage
$326,230
Interest Rate
3.87%
Mortgage Type
FHA
Purchase Details
Closed on
Jun 30, 2006
Sold by
D R Horton Inc
Bought by
To Mary and To Diana H M
Home Financials for this Owner
Home Financials are based on the most recent Mortgage that was taken out on this home.
Original Mortgage
$321,255
Interest Rate
6.63%
Mortgage Type
Unknown
Create a Home Valuation Report for This Property
The Home Valuation Report is an in-depth analysis detailing your home's value as well as a comparison with similar homes in the area
Home Values in the Area
Average Home Value in this Area
Purchase History
| Date | Buyer | Sale Price | Title Company |
|---|---|---|---|
| Anello Mark | $483,000 | None Available | |
| Anello Mark | $483,000 | Fidelity National Title | |
| To Diana H M | -- | Land Title Guarantee Company | |
| To Mary | $356,950 | Land Title |
Source: Public Records
Mortgage History
| Date | Status | Borrower | Loan Amount |
|---|---|---|---|
| Previous Owner | To Diana H M | $326,230 | |
| Previous Owner | To Mary | $321,255 |
Source: Public Records
Tax History Compared to Growth
Tax History
| Year | Tax Paid | Tax Assessment Tax Assessment Total Assessment is a certain percentage of the fair market value that is determined by local assessors to be the total taxable value of land and additions on the property. | Land | Improvement |
|---|---|---|---|---|
| 2024 | $4,770 | $44,820 | $8,440 | $36,380 |
| 2023 | $4,747 | $52,630 | $8,660 | $43,970 |
| 2022 | $3,556 | $36,260 | $8,900 | $27,360 |
| 2021 | $3,425 | $36,260 | $8,900 | $27,360 |
| 2020 | $3,322 | $36,700 | $9,150 | $27,550 |
| 2019 | $4,353 | $36,700 | $9,150 | $27,550 |
| 2018 | $4,490 | $33,100 | $6,840 | $26,260 |
| 2017 | $4,486 | $33,100 | $6,840 | $26,260 |
| 2016 | $4,012 | $29,530 | $5,730 | $23,800 |
| 2015 | $4,006 | $29,530 | $5,730 | $23,800 |
| 2014 | $3,557 | $26,500 | $5,090 | $21,410 |
Source: Public Records
Map
Nearby Homes
- 13385 Jasmine St
- 13275 Holly St Unit F
- 13349 Krameria St
- 13271 Holly St Unit B
- 13234 Krameria St
- 13243 Holly St Unit F
- 5575 E 130th Dr
- 13028 Grape Ct
- 13068 Kearney St
- 13391 Locust Ct
- 15372 Jersey Ct
- 13305 Monaco Ct
- 5341 E 129th Way
- 6345 E 135th Ave
- 5628 Hudson Cir
- 6078 E 137th Ave
- 12845 Jasmine Way
- 12812 Jasmine St Unit C
- 12799 Ivanhoe St
- 12797 Ivy St