1332 50th St Sacramento, CA 95819
East Sacramento NeighborhoodEstimated Value: $585,000 - $809,929
3
Beds
2
Baths
2,278
Sq Ft
$308/Sq Ft
Est. Value
About This Home
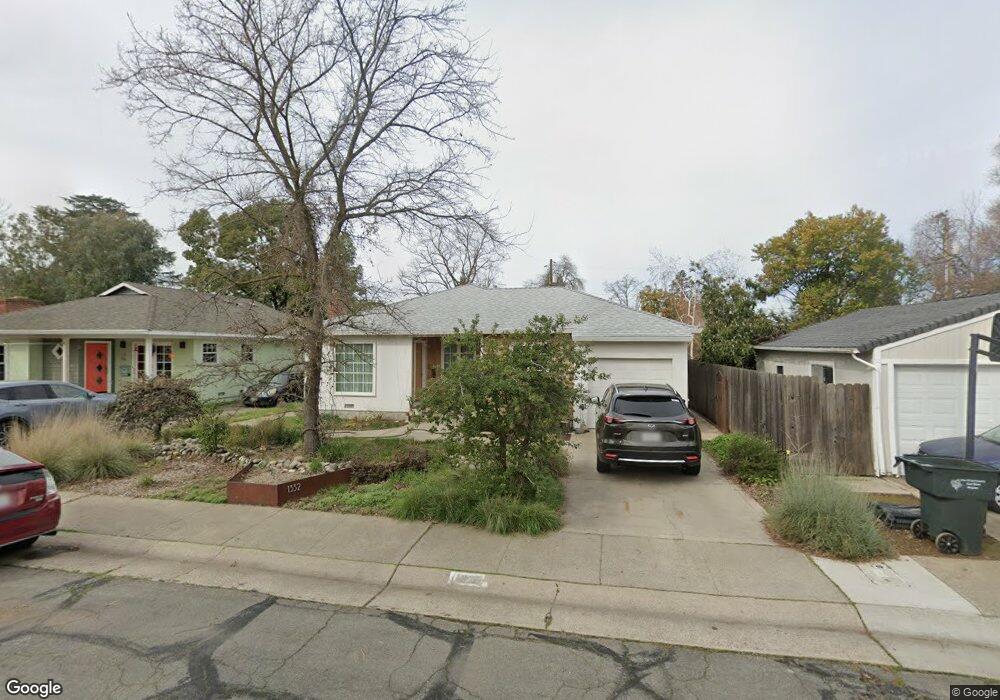
This home is located at 1332 50th St, Sacramento, CA 95819 and is currently estimated at $700,982, approximately $307 per square foot. 1332 50th St is a home located in Sacramento County with nearby schools including Caleb Greenwood Elementary, Umoja International Academy, and Hiram W. Johnson High School.
Ownership History
Date
Name
Owned For
Owner Type
Purchase Details
Closed on
Apr 21, 2016
Sold by
Melicharek Martin and Pierce Rosalind K
Bought by
Melicharek Andrew Martin Pierce and Curry Ashley
Current Estimated Value
Purchase Details
Closed on
Jun 30, 2005
Sold by
Melicharek Martin and Pierce Rosalind
Bought by
Melicharek Martin and Pierce Rosalind
Purchase Details
Closed on
Jun 24, 2005
Sold by
Donati Joseph L and Donati Starr L
Bought by
Melicharek Martin and Pierce Rosalind
Purchase Details
Closed on
Feb 25, 2003
Sold by
The Mary Scourkes Revocable Trust
Bought by
Donati Joseph L and Donati Starr L
Home Financials for this Owner
Home Financials are based on the most recent Mortgage that was taken out on this home.
Original Mortgage
$220,500
Interest Rate
5.85%
Purchase Details
Closed on
Mar 5, 1999
Sold by
Scourkes Mary
Bought by
Scourkes Mary and The Mary Scourkes Revocable Tr
Create a Home Valuation Report for This Property
The Home Valuation Report is an in-depth analysis detailing your home's value as well as a comparison with similar homes in the area
Home Values in the Area
Average Home Value in this Area
Purchase History
| Date | Buyer | Sale Price | Title Company |
|---|---|---|---|
| Melicharek Andrew Martin Pierce | -- | None Available | |
| Melicharek Martin | -- | Fidelity National Title Co | |
| Melicharek Martin | $395,000 | Fidelity National Title Co | |
| Donati Joseph L | $245,000 | Fidelity National Title Co | |
| Scourkes Mary | -- | -- |
Source: Public Records
Mortgage History
| Date | Status | Borrower | Loan Amount |
|---|---|---|---|
| Previous Owner | Donati Joseph L | $220,500 |
Source: Public Records
Tax History Compared to Growth
Tax History
| Year | Tax Paid | Tax Assessment Tax Assessment Total Assessment is a certain percentage of the fair market value that is determined by local assessors to be the total taxable value of land and additions on the property. | Land | Improvement |
|---|---|---|---|---|
| 2025 | $7,449 | $643,822 | $355,303 | $288,519 |
| 2024 | $7,449 | $631,199 | $348,337 | $282,862 |
| 2023 | $7,273 | $618,823 | $341,507 | $277,316 |
| 2022 | $6,396 | $542,651 | $334,811 | $207,840 |
| 2021 | $5,717 | $498,679 | $328,247 | $170,432 |
| 2020 | $5,768 | $493,567 | $324,882 | $168,685 |
| 2019 | $5,645 | $483,890 | $318,512 | $165,378 |
| 2018 | $5,498 | $474,403 | $312,267 | $162,136 |
| 2017 | $5,423 | $465,102 | $306,145 | $158,957 |
| 2016 | $4,764 | $407,953 | $268,526 | $139,427 |
| 2015 | $4,500 | $384,862 | $253,327 | $131,535 |
| 2014 | $4,336 | $373,653 | $245,949 | $127,704 |
Source: Public Records
Map
Nearby Homes