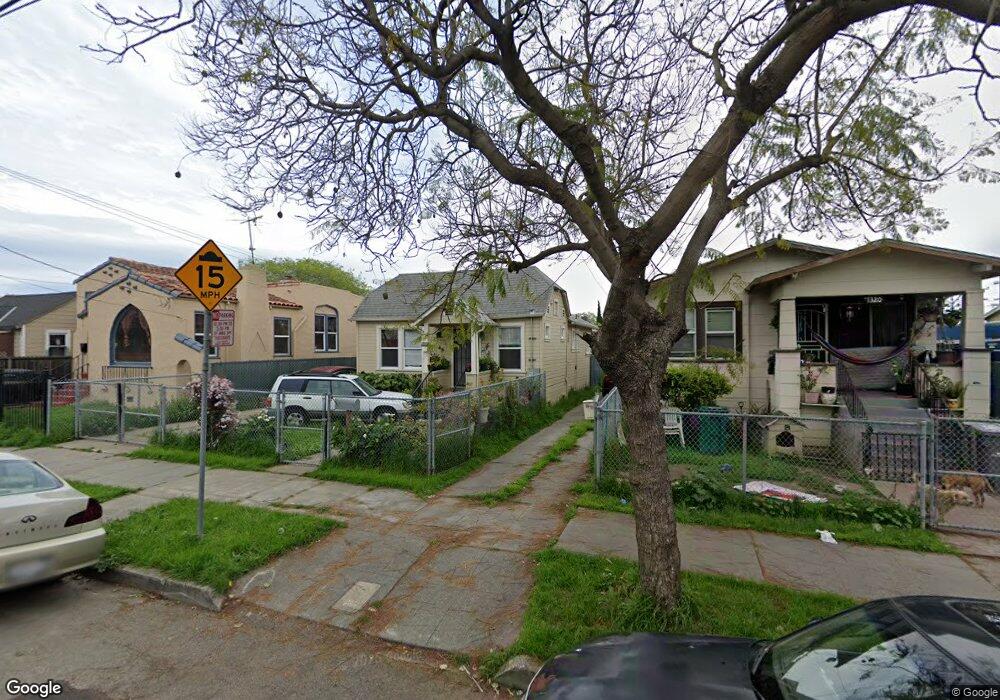
1332 87th Ave Oakland, CA 94621
Highland NeighborhoodEstimated Value: $360,000 - $451,000
2
Beds
1
Bath
825
Sq Ft
$471/Sq Ft
Est. Value
About This Home
This home is located at 1332 87th Ave, Oakland, CA 94621 and is currently estimated at $388,182, approximately $470 per square foot. 1332 87th Ave is a home located in Alameda County with nearby schools including New Highland Academy, Acorn Woodland Elementary School, and Encompass Academy Elementary.
Ownership History
Date
Name
Owned For
Owner Type
Purchase Details
Closed on
Dec 27, 2021
Sold by
Marr Michael W and Marr Family Revocable Trust
Bought by
Mejvm Llc
Current Estimated Value
Purchase Details
Closed on
Nov 3, 2005
Sold by
Marr Michael W
Bought by
Marr Michael W
Home Financials for this Owner
Home Financials are based on the most recent Mortgage that was taken out on this home.
Original Mortgage
$367,500
Interest Rate
1.5%
Mortgage Type
New Conventional
Create a Home Valuation Report for This Property
The Home Valuation Report is an in-depth analysis detailing your home's value as well as a comparison with similar homes in the area
Home Values in the Area
Average Home Value in this Area
Purchase History
| Date | Buyer | Sale Price | Title Company |
|---|---|---|---|
| Mejvm Llc | -- | Old Republic Title | |
| Marr Michael W | -- | Old Republic Title Company |
Source: Public Records
Mortgage History
| Date | Status | Borrower | Loan Amount |
|---|---|---|---|
| Previous Owner | Marr Michael W | $367,500 |
Source: Public Records
Tax History
| Year | Tax Paid | Tax Assessment Tax Assessment Total Assessment is a certain percentage of the fair market value that is determined by local assessors to be the total taxable value of land and additions on the property. | Land | Improvement |
|---|---|---|---|---|
| 2025 | $2,629 | $63,938 | $20,508 | $43,430 |
| 2024 | $2,629 | $62,685 | $20,106 | $42,579 |
| 2023 | $2,631 | $61,456 | $19,712 | $41,744 |
| 2022 | $2,487 | $60,252 | $19,326 | $40,926 |
| 2021 | $2,218 | $59,070 | $18,947 | $40,123 |
| 2020 | $2,191 | $58,465 | $18,753 | $39,712 |
| 2019 | $2,008 | $57,319 | $18,385 | $38,934 |
| 2018 | $1,970 | $56,195 | $18,025 | $38,170 |
| 2017 | $1,857 | $55,093 | $17,671 | $37,422 |
| 2016 | $1,700 | $54,013 | $17,325 | $36,688 |
| 2015 | $1,686 | $53,203 | $17,065 | $36,138 |
| 2014 | $1,585 | $52,160 | $16,730 | $35,430 |
Source: Public Records
Map
Nearby Homes
Your Personal Tour Guide
Ask me questions while you tour the home.