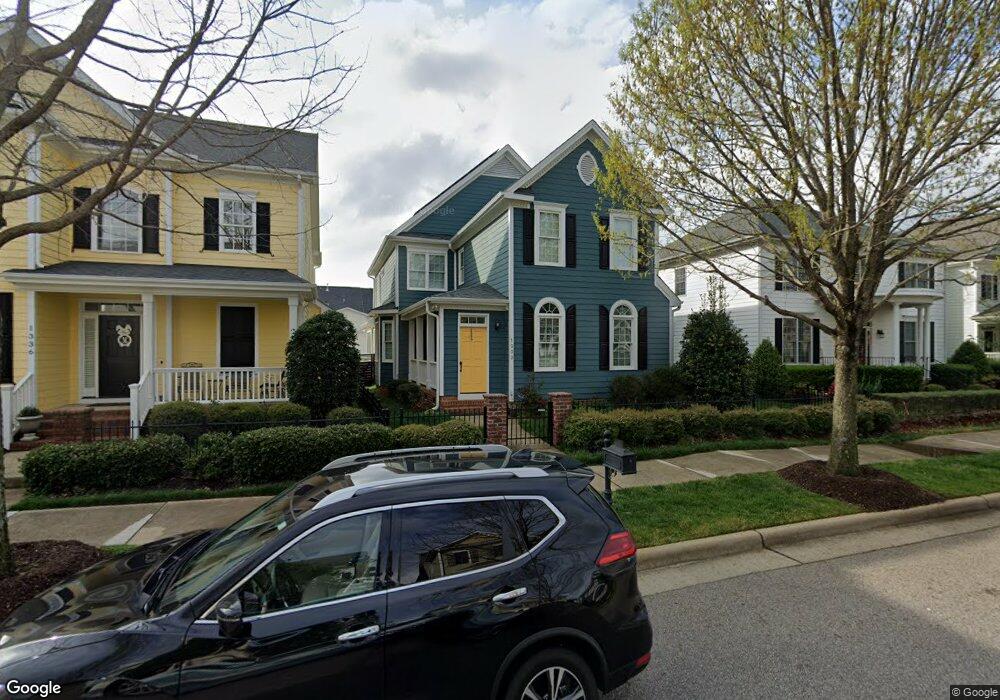
1332 Ileagnes Rd Raleigh, NC 27603
Renaissance Park NeighborhoodEstimated Value: $604,000 - $683,000
4
Beds
4
Baths
2,792
Sq Ft
$226/Sq Ft
Est. Value
About This Home
This home is located at 1332 Ileagnes Rd, Raleigh, NC 27603 and is currently estimated at $631,083, approximately $226 per square foot. 1332 Ileagnes Rd is a home located in Wake County with nearby schools including Smith Elementary, North Garner Middle, and Garner High.
Ownership History
Date
Name
Owned For
Owner Type
Purchase Details
Closed on
Oct 25, 2019
Sold by
Velasco Luis E and Velasco Helen Hanna
Bought by
Callahan Debbie Ann
Current Estimated Value
Home Financials for this Owner
Home Financials are based on the most recent Mortgage that was taken out on this home.
Original Mortgage
$338,268
Outstanding Balance
$296,340
Interest Rate
3.5%
Mortgage Type
New Conventional
Estimated Equity
$334,743
Purchase Details
Closed on
Feb 9, 2018
Sold by
Velasco Luis E and Hanna Helen M
Bought by
Velasco Luis E and Hanna Helen M
Home Financials for this Owner
Home Financials are based on the most recent Mortgage that was taken out on this home.
Original Mortgage
$269,000
Interest Rate
3.95%
Mortgage Type
New Conventional
Purchase Details
Closed on
Jul 30, 2010
Sold by
Upright Builders Inc
Bought by
Velasco Luis E and Hanna Helena M
Home Financials for this Owner
Home Financials are based on the most recent Mortgage that was taken out on this home.
Original Mortgage
$312,550
Interest Rate
4.74%
Mortgage Type
Purchase Money Mortgage
Create a Home Valuation Report for This Property
The Home Valuation Report is an in-depth analysis detailing your home's value as well as a comparison with similar homes in the area
Home Values in the Area
Average Home Value in this Area
Purchase History
| Date | Buyer | Sale Price | Title Company |
|---|---|---|---|
| Callahan Debbie Ann | $395,000 | None Available | |
| Velasco Luis E | -- | None Available | |
| Velasco Luis E | $329,000 | None Available |
Source: Public Records
Mortgage History
| Date | Status | Borrower | Loan Amount |
|---|---|---|---|
| Open | Callahan Debbie Ann | $338,268 | |
| Previous Owner | Velasco Luis E | $269,000 | |
| Previous Owner | Velasco Luis E | $312,550 |
Source: Public Records
Tax History Compared to Growth
Tax History
| Year | Tax Paid | Tax Assessment Tax Assessment Total Assessment is a certain percentage of the fair market value that is determined by local assessors to be the total taxable value of land and additions on the property. | Land | Improvement |
|---|---|---|---|---|
| 2025 | $5,125 | $585,391 | $120,000 | $465,391 |
| 2024 | $5,104 | $585,391 | $120,000 | $465,391 |
| 2023 | $4,576 | $417,936 | $70,000 | $347,936 |
| 2022 | $4,252 | $417,936 | $70,000 | $347,936 |
| 2021 | $4,087 | $417,936 | $70,000 | $347,936 |
| 2020 | $4,012 | $417,936 | $70,000 | $347,936 |
| 2019 | $4,296 | $368,955 | $58,000 | $310,955 |
| 2018 | $4,051 | $368,955 | $58,000 | $310,955 |
| 2017 | $3,858 | $368,955 | $58,000 | $310,955 |
| 2016 | $3,779 | $368,955 | $58,000 | $310,955 |
| 2015 | $4,031 | $387,313 | $78,000 | $309,313 |
| 2014 | $3,823 | $387,313 | $78,000 | $309,313 |
Source: Public Records
Map
Nearby Homes
- 1314 Still Monument Way
- 513 Dragby Ln
- 1130 Renewal Place Unit 100
- 1120 Renewal Place Unit 113
- 1120 Renewal Place Unit 111
- 3616 Olympia Dr
- 3634 Olympia Dr
- 3636 Olympia Dr
- 412 Stone Flower Ln
- 653 Democracy St
- 1229 Chapanoke Rd
- 1300 Formal Garden Way
- 800 Chapanoke Rd
- 948 Consortium Dr
- 601 Cupola Dr
- 852 Cupola Dr
- 1204 Chapanoke Rd
- 913 Chapanoke Rd
- 831 Historian St
- 648 Cupola Dr
- 906 Ileagnes Rd
- 902 Ileagnes Rd
- 802-822 Ileagnes Rd
- 902 & 906 Ileagnes Rd
- 1328 Ileagnes Rd
- 1333 Still Monument Way
- 1340 Ileagnes Rd
- 1337 Still Monument Way
- 1335 Still Monument Way
- 1327 Still Monument Way
- 1339 Still Monument Way
- 1325 Still Monument Way
- 1323 Still Monument Way
- 1320 Ileagnes Rd
- 1331 Ileagnes Rd
- 1344 Ileagnes Rd
- 1327 Ileagnes Rd
- 1335 Ileagnes Rd
- 1323 Ileagnes Rd
- 1323 Ileagnes Rd Unit 1430