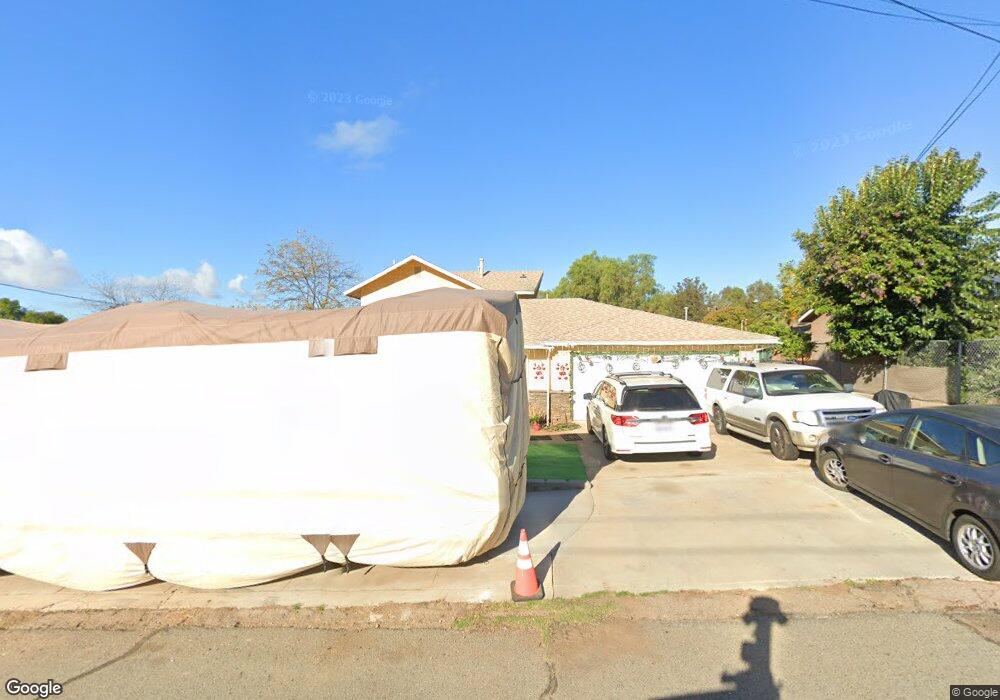
1332 Somermont Dr El Cajon, CA 92021
Bostonia NeighborhoodEstimated Value: $868,110 - $1,024,000
4
Beds
3
Baths
2,558
Sq Ft
$371/Sq Ft
Est. Value
About This Home
This home is located at 1332 Somermont Dr, El Cajon, CA 92021 and is currently estimated at $949,278, approximately $371 per square foot. 1332 Somermont Dr is a home located in San Diego County with nearby schools including Pepper Drive Elementary School, Santana High School, and Kidinnu Academy.
Ownership History
Date
Name
Owned For
Owner Type
Purchase Details
Closed on
Mar 25, 2010
Sold by
Marbury Park Group Llc
Bought by
Binion Joseph A and Anderson Binion Kimberly Anne
Current Estimated Value
Home Financials for this Owner
Home Financials are based on the most recent Mortgage that was taken out on this home.
Original Mortgage
$356,503
Outstanding Balance
$235,099
Interest Rate
4.88%
Mortgage Type
VA
Estimated Equity
$714,179
Purchase Details
Closed on
Dec 11, 2009
Sold by
Rarick Jacob E and Rarick Linda
Bought by
Marbury Park Group Llc
Purchase Details
Closed on
Mar 24, 2006
Sold by
Merrill Carla
Bought by
Rarick Jacob E and Rarick Linda
Home Financials for this Owner
Home Financials are based on the most recent Mortgage that was taken out on this home.
Original Mortgage
$106,600
Interest Rate
6.29%
Mortgage Type
Stand Alone Second
Create a Home Valuation Report for This Property
The Home Valuation Report is an in-depth analysis detailing your home's value as well as a comparison with similar homes in the area
Home Values in the Area
Average Home Value in this Area
Purchase History
| Date | Buyer | Sale Price | Title Company |
|---|---|---|---|
| Binion Joseph A | $349,000 | Fidelity National Title Co | |
| Marbury Park Group Llc | $285,000 | Fidelity National Title Co | |
| Rarick Jacob E | $533,000 | Equity Title Co San Diego |
Source: Public Records
Mortgage History
| Date | Status | Borrower | Loan Amount |
|---|---|---|---|
| Open | Binion Joseph A | $356,503 | |
| Previous Owner | Rarick Jacob E | $106,600 | |
| Previous Owner | Rarick Jacob E | $426,400 |
Source: Public Records
Tax History
| Year | Tax Paid | Tax Assessment Tax Assessment Total Assessment is a certain percentage of the fair market value that is determined by local assessors to be the total taxable value of land and additions on the property. | Land | Improvement |
|---|---|---|---|---|
| 2025 | $5,327 | $450,483 | $193,062 | $257,421 |
| 2024 | $5,327 | $441,651 | $189,277 | $252,374 |
| 2023 | $5,162 | $432,992 | $185,566 | $247,426 |
| 2022 | $5,125 | $424,503 | $181,928 | $242,575 |
| 2021 | $5,061 | $416,180 | $178,361 | $237,819 |
| 2020 | $5,001 | $411,914 | $176,533 | $235,381 |
| 2019 | $4,828 | $403,838 | $173,072 | $230,766 |
| 2018 | $4,728 | $395,921 | $169,679 | $226,242 |
| 2017 | $4,666 | $388,158 | $166,352 | $221,806 |
| 2016 | $4,524 | $380,548 | $163,091 | $217,457 |
| 2015 | $4,457 | $374,833 | $160,642 | $214,191 |
| 2014 | $4,366 | $367,492 | $157,496 | $209,996 |
Source: Public Records
Map
Nearby Homes
- 1395 Somermont Dr
- 1120 Pepper Dr Unit 82
- 1120 Pepper Dr Unit SPC 86
- 1120 Pepper Dr Unit 139
- 1120 Pepper Dr Unit 136
- 1120 Pepper Dr Unit 73
- 1120 Pepper Dr Unit 100
- 1120 Pepper Dr Unit 141
- 1120 Pepper Dr Unit 144
- 8211 Limon Ln
- 1688 Buckeye Dr
- 1693 N Mollison Ave
- 751 E Bradley Ave Unit 44
- 450 E Bradley Ave Unit 10
- 450 E Bradley Ave Unit 158
- 450 E Bradley Ave Unit 157
- 450 E Bradley Ave Unit 144
- 450 E Bradley Ave Unit 80
- 450 E Bradley Ave Unit 151
- 450 E Bradley Ave Unit 127
- 1336 Somermont Dr
- 1328 Somermont Dr
- 1329 Clove St
- 1340 Somermont Dr
- 1324 Somermont Dr
- 1325 Clove St
- 1321 Clove St
- 1337 Clove St
- 1331 Somermont Dr
- 1335 Somermont Dr
- 1344 Somermont Dr
- 1320 Somermont Dr
- 1327 Somermont Dr
- 1339 Somermont Dr
- 1323 Somermont Dr
- 1317 Clove St
- 1341 Clove St
- 1343 Somermont Dr
- 1316 Somermont Dr
- 1348 Somermont Dr
Your Personal Tour Guide
Ask me questions while you tour the home.