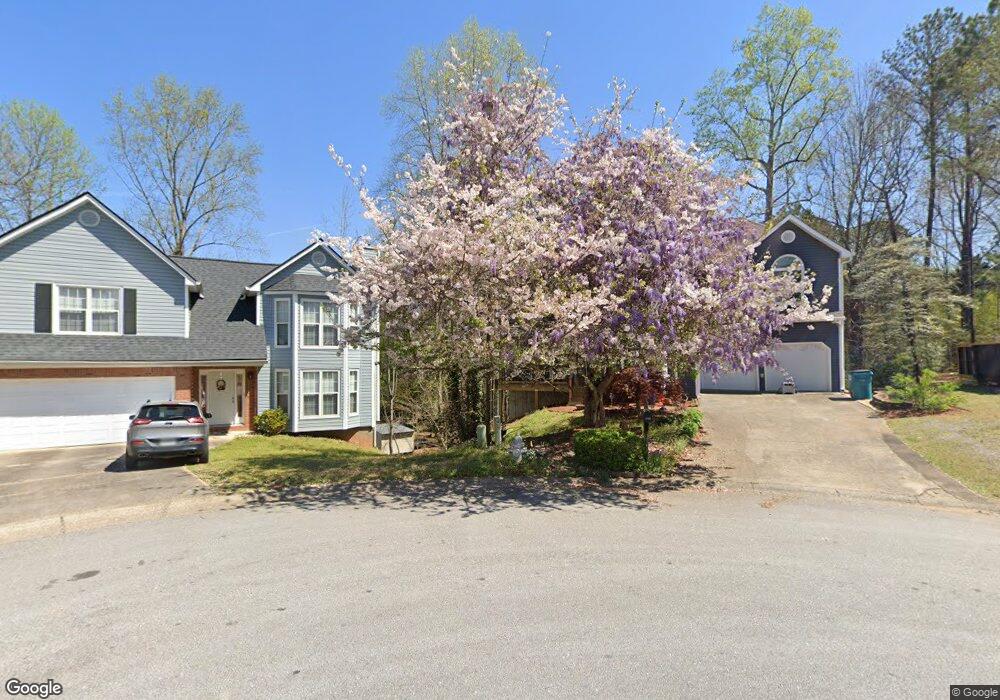
1332 Windage Ct SW Unit 5 Marietta, GA 30008
Southwestern Marietta NeighborhoodEstimated Value: $356,501 - $375,000
3
Beds
3
Baths
1,866
Sq Ft
$194/Sq Ft
Est. Value
About This Home
This home is located at 1332 Windage Ct SW Unit 5, Marietta, GA 30008 and is currently estimated at $362,875, approximately $194 per square foot. 1332 Windage Ct SW Unit 5 is a home located in Cobb County with nearby schools including Milford Elementary School, Smitha Middle School, and Osborne High School.
Ownership History
Date
Name
Owned For
Owner Type
Purchase Details
Closed on
Apr 4, 2003
Sold by
Robinson Brian C
Bought by
Shaul Pakpoom
Current Estimated Value
Home Financials for this Owner
Home Financials are based on the most recent Mortgage that was taken out on this home.
Original Mortgage
$152,793
Outstanding Balance
$65,398
Interest Rate
5.82%
Mortgage Type
FHA
Estimated Equity
$297,477
Purchase Details
Closed on
Jan 29, 1999
Sold by
Gerber Irving W and Gerber Maureen P
Bought by
Robinson Brian C
Home Financials for this Owner
Home Financials are based on the most recent Mortgage that was taken out on this home.
Original Mortgage
$119,100
Interest Rate
6.8%
Mortgage Type
New Conventional
Purchase Details
Closed on
Feb 15, 1994
Sold by
Bennettbuilt Inc
Bought by
Gerber Irving W Maureen P
Home Financials for this Owner
Home Financials are based on the most recent Mortgage that was taken out on this home.
Original Mortgage
$88,000
Interest Rate
6.97%
Create a Home Valuation Report for This Property
The Home Valuation Report is an in-depth analysis detailing your home's value as well as a comparison with similar homes in the area
Home Values in the Area
Average Home Value in this Area
Purchase History
| Date | Buyer | Sale Price | Title Company |
|---|---|---|---|
| Shaul Pakpoom | $154,000 | -- | |
| Robinson Brian C | $132,400 | -- | |
| Gerber Irving W Maureen P | $110,000 | -- |
Source: Public Records
Mortgage History
| Date | Status | Borrower | Loan Amount |
|---|---|---|---|
| Open | Shaul Pakpoom | $152,793 | |
| Previous Owner | Robinson Brian C | $119,100 | |
| Previous Owner | Gerber Irving W Maureen P | $88,000 |
Source: Public Records
Tax History Compared to Growth
Tax History
| Year | Tax Paid | Tax Assessment Tax Assessment Total Assessment is a certain percentage of the fair market value that is determined by local assessors to be the total taxable value of land and additions on the property. | Land | Improvement |
|---|---|---|---|---|
| 2025 | $4,431 | $147,072 | $28,000 | $119,072 |
| 2024 | $4,434 | $147,072 | $28,000 | $119,072 |
| 2023 | $3,588 | $119,020 | $15,200 | $103,820 |
| 2022 | $2,713 | $89,392 | $14,000 | $75,392 |
| 2021 | $2,713 | $89,392 | $14,000 | $75,392 |
| 2020 | $2,307 | $76,020 | $14,000 | $62,020 |
| 2019 | $2,027 | $66,792 | $10,000 | $56,792 |
| 2018 | $2,027 | $66,792 | $10,000 | $56,792 |
| 2017 | $1,739 | $60,472 | $10,000 | $50,472 |
| 2016 | $1,739 | $60,472 | $10,000 | $50,472 |
| 2015 | $1,355 | $45,996 | $8,800 | $37,196 |
| 2014 | $1,367 | $45,996 | $0 | $0 |
Source: Public Records
Map
Nearby Homes
- 1345 Windage Ct SW Unit 6
- 1104 Havel Dr SW
- 2615 Windage Dr SW
- 1086 Mornington Way
- 1105 Woodleigh Rd SW
- 1308 Willamette Way
- 2964 Edgemont Ln SW
- 2907 Crest Ridge Ct SW
- 3075 Milford Chase SW
- 1197 Woodleigh Rd SW
- 881 Whittington Pkwy
- 1020 Hicksmil Dr SW
- 3004 Michael Dr SW
- 2940 Caller Ct SW
- 2760 Hicks Rd SW
- 2381 Lakeside Place SW
- 1334 Windage Ct SW
- 1333 Windage Ct SW
- 1336 Windage Ct SW
- 1312 Waymar Way SW Unit 1
- 1312 Waymar Way SW
- 1119 Karastan Ct SW
- 1313 Waymar Way SW
- 1338 Windage Ct SW
- 1340 Windage Ct SW
- 1335 Windage Ct SW
- 1118 Karastan Ct SW
- 1310 Waymar Way SW Unit 1
- 1117 Karastan Ct SW Unit 3
- 1342 Windage Ct SW
- 1311 Waymar Way SW Unit 1
- 1311 Waymar Way SW Unit 30
- 1337 Windage Ct SW Unit 6
- 1337 Windage Ct SW
- 2701 Waymar Dr SW
- 1306 Waymar Way SW