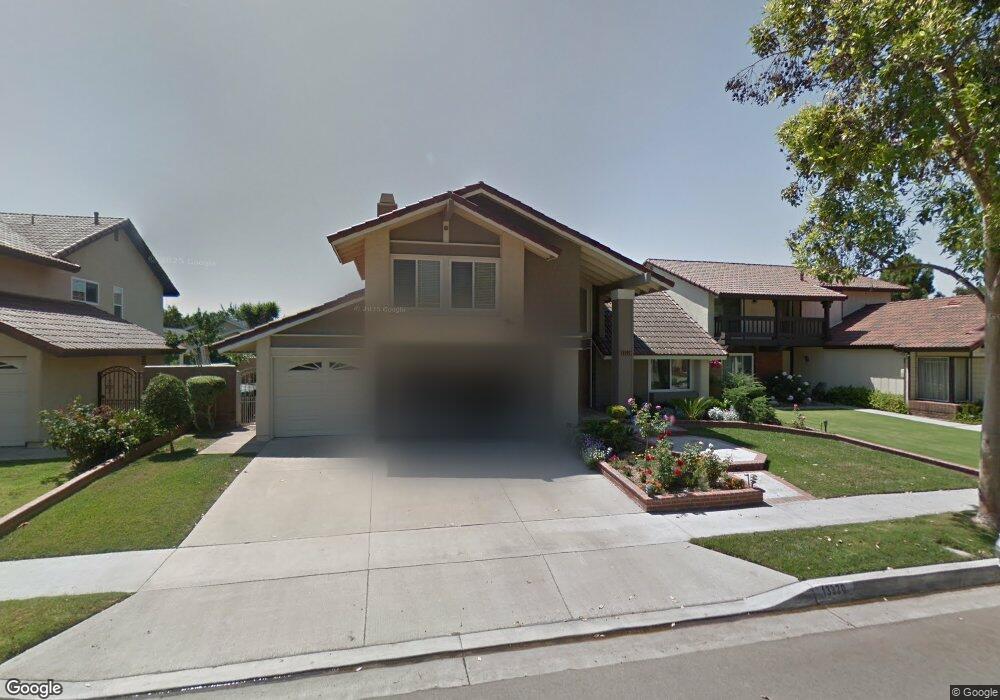
13320 Rusty Fig Cir Cerritos, CA 90703
Estimated Value: $1,511,000 - $2,029,000
4
Beds
3
Baths
2,562
Sq Ft
$652/Sq Ft
Est. Value
About This Home
This home is located at 13320 Rusty Fig Cir, Cerritos, CA 90703 and is currently estimated at $1,671,002, approximately $652 per square foot. 13320 Rusty Fig Cir is a home located in Los Angeles County with nearby schools including Cecil B. Stowers Elementary School, Carmenita Middle School, and Cerritos High School.
Ownership History
Date
Name
Owned For
Owner Type
Purchase Details
Closed on
Jul 19, 2011
Sold by
Choi Hyun Jong and Choi Hee Chung
Bought by
Chang Ho Jan and Liao Ruey Wen
Current Estimated Value
Home Financials for this Owner
Home Financials are based on the most recent Mortgage that was taken out on this home.
Original Mortgage
$400,000
Outstanding Balance
$274,538
Interest Rate
4.46%
Mortgage Type
New Conventional
Estimated Equity
$1,396,464
Purchase Details
Closed on
May 25, 2004
Sold by
Choi Hyun Jong and Choi Hee Chung
Bought by
Choi Hyun Jong
Purchase Details
Closed on
Mar 30, 2001
Sold by
Choi Hee Chung
Bought by
Choi Hyun J
Home Financials for this Owner
Home Financials are based on the most recent Mortgage that was taken out on this home.
Original Mortgage
$272,000
Interest Rate
7.19%
Purchase Details
Closed on
Jul 7, 1995
Sold by
Choi Hyun Jong
Bought by
Choi Hee Chung
Create a Home Valuation Report for This Property
The Home Valuation Report is an in-depth analysis detailing your home's value as well as a comparison with similar homes in the area
Home Values in the Area
Average Home Value in this Area
Purchase History
We collect this data history from publicly available records. To have your information removed, we recommend requesting removal directly through your county’s website.
| Date | Buyer | Sale Price | Title Company |
|---|---|---|---|
| Chang Ho Jan | $838,000 | Ticor Title Co | |
| Choi Hyun Jong | -- | -- | |
| Choi Hyun J | -- | United Title Company | |
| Choi Hee Chung | -- | -- |
Source: Public Records
Mortgage History
We collect this data history from publicly available records. To have your information removed, we recommend requesting removal directly through your county’s website.
| Date | Status | Borrower | Loan Amount |
|---|---|---|---|
| Open | Chang Ho Jan | $400,000 | |
| Previous Owner | Choi Hyun J | $272,000 |
Source: Public Records
Tax History
| Year | Tax Paid | Tax Assessment Tax Assessment Total Assessment is a certain percentage of the fair market value that is determined by local assessors to be the total taxable value of land and additions on the property. | Land | Improvement |
|---|---|---|---|---|
| 2025 | $12,284 | $1,052,565 | $537,461 | $515,104 |
| 2024 | $12,284 | $1,031,927 | $526,923 | $505,004 |
| 2023 | $11,874 | $1,011,694 | $516,592 | $495,102 |
| 2022 | $11,694 | $991,858 | $506,463 | $485,395 |
| 2021 | $11,414 | $972,411 | $496,533 | $475,878 |
| 2019 | $11,149 | $943,570 | $481,806 | $461,764 |
| 2018 | $10,356 | $925,069 | $472,359 | $452,710 |
| 2016 | $9,948 | $889,150 | $454,018 | $435,132 |
| 2015 | $9,819 | $875,795 | $447,199 | $428,596 |
| 2014 | $9,610 | $858,640 | $438,439 | $420,201 |
Source: Public Records
Map
Nearby Homes
- 13408 Moore St
- 16403 Holmes Place
- 13440 Beach St
- 13440 1 2 Village Dr
- 13451 1/4 Village Dr
- 17203 Leslie Ave
- 13635 Palm St
- 16602 Yvette Way
- 13010 Artesia Blvd
- 13557 Semora Place
- 13130 Rose St
- 17405 Jasmine Way
- 17918 Pires Ave
- 13138 Sutton St
- 16902 Chaparral Ave
- 17826 Caliente Cir
- 15502 Roper Ave
- 18420 Heather Ave
- 15523 Lancelot Ave
- 12947 Arabella Place
- 13321 Fern Pine Cir
- 13331 Fern Pine Cir
- 13313 Fern Pine Cir
- 13330 Rusty Fig Cir
- 13312 Rusty Fig Cir
- 13337 Fern Pine Cir
- 13303 Fern Pine Cir
- 13320 Fern Pine Cir
- 13330 Fern Pine Cir
- 13312 Fern Pine Cir
- 13336 Rusty Fig Cir
- 13302 Rusty Fig Cir
- 13347 Fern Pine Cir
- 13336 Fern Pine Cir
- 13302 Fern Pine Cir
- 13346 Rusty Fig Cir
- 13346 Fern Pine Cir
- 13355 Fern Pine Cir
- 13321 Red Plum St
- 13321 Rusty Fig Cir
Your Personal Tour Guide
Ask me questions while you tour the home.