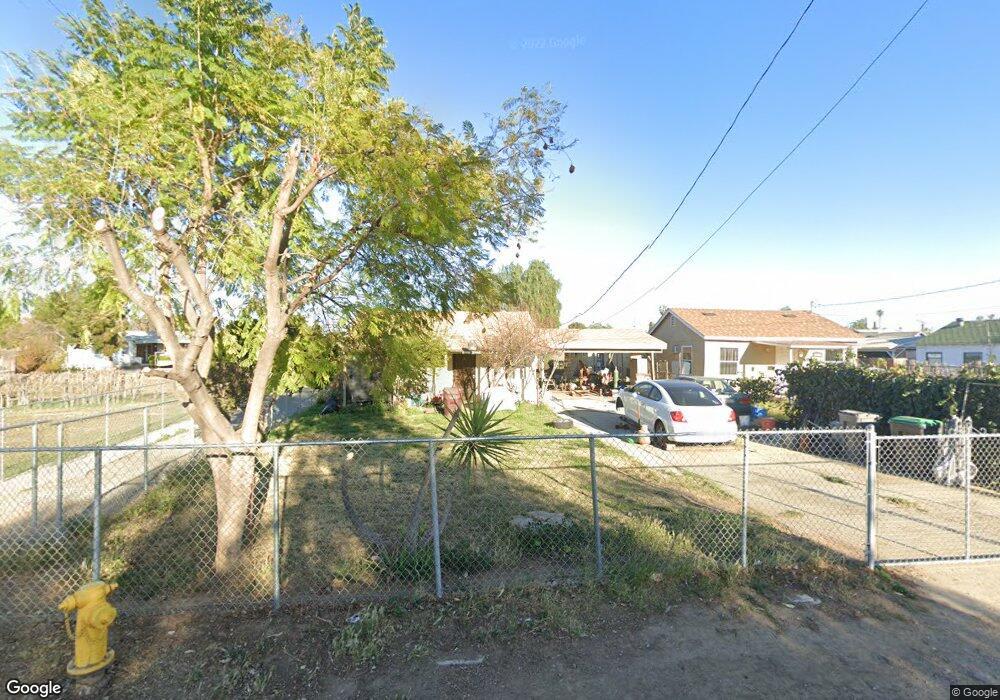
13324 Edgemont St Moreno Valley, CA 92553
Edgemont NeighborhoodEstimated Value: $235,000 - $401,000
2
Beds
2
Baths
576
Sq Ft
$599/Sq Ft
Est. Value
About This Home
This home is located at 13324 Edgemont St, Moreno Valley, CA 92553 and is currently estimated at $344,865, approximately $598 per square foot. 13324 Edgemont St is a home located in Riverside County with nearby schools including Edgemont Elementary School, Sunnymead Middle School, and Moreno Valley High School.
Ownership History
Date
Name
Owned For
Owner Type
Purchase Details
Closed on
Feb 20, 2018
Sold by
Paramo Raymond
Bought by
Paramo Raymond and Guillen Paramo Martha
Current Estimated Value
Home Financials for this Owner
Home Financials are based on the most recent Mortgage that was taken out on this home.
Original Mortgage
$100,000
Outstanding Balance
$85,546
Interest Rate
4.4%
Mortgage Type
New Conventional
Estimated Equity
$259,319
Purchase Details
Closed on
Dec 16, 2009
Sold by
Paramo Raymond Juarez
Bought by
Paramo Raymond
Purchase Details
Closed on
May 8, 2000
Sold by
California Federal Bank Fsb
Bought by
Wigington Leland
Purchase Details
Closed on
Apr 5, 2000
Sold by
Juneja Bachittar S and Juneja Anju
Bought by
California Federal Bank Fsb
Purchase Details
Closed on
Feb 16, 1999
Sold by
Juneja Anju Bala
Bought by
Juneja Bachittar S
Create a Home Valuation Report for This Property
The Home Valuation Report is an in-depth analysis detailing your home's value as well as a comparison with similar homes in the area
Home Values in the Area
Average Home Value in this Area
Purchase History
| Date | Buyer | Sale Price | Title Company |
|---|---|---|---|
| Paramo Raymond | -- | Wfg National Title | |
| Paramo Raymond | -- | South Coast Title Company | |
| Wigington Leland | $30,000 | Southland Title | |
| California Federal Bank Fsb | $33,250 | Chicago Title Co | |
| Juneja Bachittar S | -- | -- |
Source: Public Records
Mortgage History
| Date | Status | Borrower | Loan Amount |
|---|---|---|---|
| Open | Paramo Raymond | $100,000 |
Source: Public Records
Tax History Compared to Growth
Tax History
| Year | Tax Paid | Tax Assessment Tax Assessment Total Assessment is a certain percentage of the fair market value that is determined by local assessors to be the total taxable value of land and additions on the property. | Land | Improvement |
|---|---|---|---|---|
| 2025 | $1,189 | $77,428 | $38,715 | $38,713 |
| 2023 | $1,189 | $74,422 | $37,212 | $37,210 |
| 2022 | $1,100 | $72,964 | $36,483 | $36,481 |
| 2021 | $1,084 | $71,534 | $35,768 | $35,766 |
| 2020 | $1,075 | $70,802 | $35,402 | $35,400 |
| 2019 | $1,062 | $69,414 | $34,708 | $34,706 |
| 2018 | $1,010 | $68,054 | $34,027 | $34,027 |
| 2017 | $956 | $66,720 | $33,360 | $33,360 |
| 2016 | $948 | $65,412 | $32,706 | $32,706 |
| 2015 | $937 | $64,432 | $32,216 | $32,216 |
| 2014 | $885 | $63,172 | $31,586 | $31,586 |
Source: Public Records
Map
Nearby Homes
- 13209 Edgemont St Unit A&B
- 21840 Cottonwood Ave
- 13277 Day St
- 21737 Eucalyptus Ave
- 22015 Cottonwood Ave
- 21981 Eucalyptus Ave
- 1 Bay Ave
- 22265 Bay Ave
- 13122 Westminster Ln
- 22350 Yorke Rd Unit 18
- 13100 Palisade Place
- 22677 Westlake Dr
- 13162 Brentwood Ln
- 13126 Kiowa Dr
- 13055 Lakota St
- 13316 Pan am Blvd
- 22790 Allies Place
- 22959 Vought St
- 13241 Oak Dell St
- 22850 Allies Place
- 13332 Edgemont St
- 13346 Edgemont St
- 0 Edgemont St Unit 21443556DA
- 0 Edgemont St Unit IV21126011
- 0 Edgemont St Unit CV19078700
- 0 Edgemont St
- 13308 Edgemont St
- 13352 Edgemont St
- 13288 Edgemont St
- 13276 Edgemont St
- 13380 Edgemont St
- 13363 Edgemont St
- 13279 Edgemont St
- 21759 Dracaea Ave
- 21791 Dracaea Ave
- 13390 Edgemont St
- 13369 Edgemont St
- 13269 Edgemont St
- 21773 Dracaea Ave
- 13381 Edgemont St