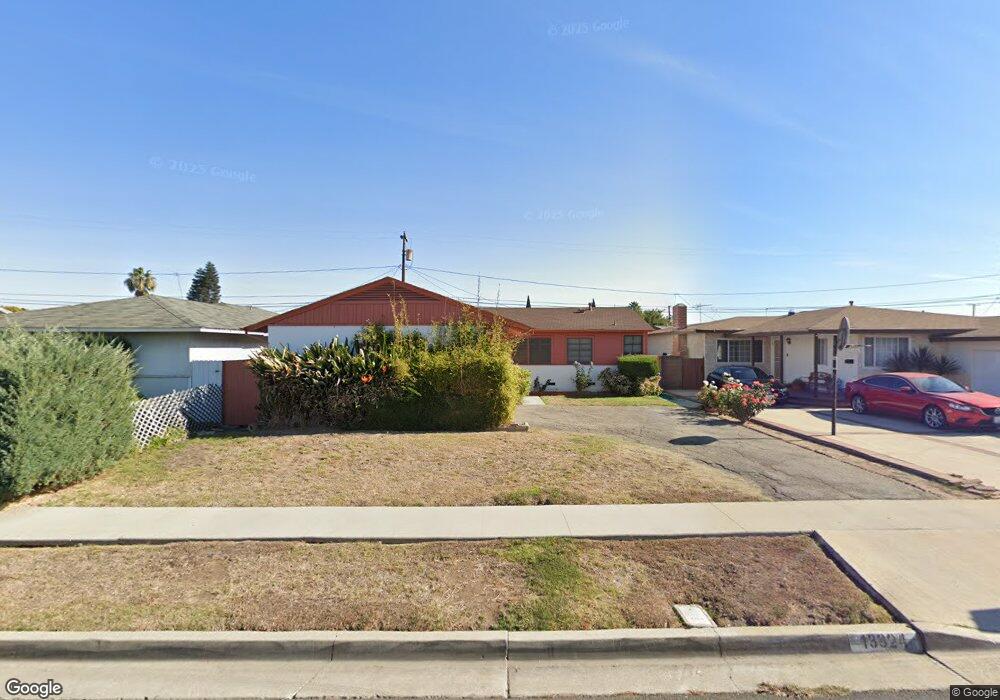
13324 Ruthelen St Gardena, CA 90249
Estimated Value: $722,000 - $777,000
3
Beds
2
Baths
1,312
Sq Ft
$572/Sq Ft
Est. Value
About This Home
This home is located at 13324 Ruthelen St, Gardena, CA 90249 and is currently estimated at $750,711, approximately $572 per square foot. 13324 Ruthelen St is a home located in Los Angeles County with nearby schools including Purche Avenue Elementary School, Robert E. Peary Middle School, and Gardena Senior High School.
Ownership History
Date
Name
Owned For
Owner Type
Purchase Details
Closed on
Oct 20, 2017
Sold by
Coggins Tracy
Bought by
Coggins Tracy
Current Estimated Value
Home Financials for this Owner
Home Financials are based on the most recent Mortgage that was taken out on this home.
Original Mortgage
$265,000
Outstanding Balance
$221,112
Interest Rate
3.78%
Mortgage Type
New Conventional
Estimated Equity
$529,599
Purchase Details
Closed on
Aug 3, 2017
Sold by
Coggins Tracy
Bought by
Coggins Tracy and The Tracy Coggins Living Trust
Purchase Details
Closed on
Jul 18, 2012
Sold by
Spears Bonita E and Ingram Teresa C
Bought by
Coggins Tracy
Home Financials for this Owner
Home Financials are based on the most recent Mortgage that was taken out on this home.
Original Mortgage
$151,250
Interest Rate
3.62%
Mortgage Type
New Conventional
Purchase Details
Closed on
Sep 13, 1995
Sold by
Coggins Viadalia
Bought by
Coggins Viadalia and Viadalia Coggins Family Trust
Create a Home Valuation Report for This Property
The Home Valuation Report is an in-depth analysis detailing your home's value as well as a comparison with similar homes in the area
Home Values in the Area
Average Home Value in this Area
Purchase History
| Date | Buyer | Sale Price | Title Company |
|---|---|---|---|
| Coggins Tracy | -- | Lawyers Title Company | |
| Coggins Tracy | -- | None Available | |
| Coggins Tracy | -- | Priority Title | |
| Coggins Viadalia | -- | -- |
Source: Public Records
Mortgage History
| Date | Status | Borrower | Loan Amount |
|---|---|---|---|
| Open | Coggins Tracy | $265,000 | |
| Closed | Coggins Tracy | $151,250 |
Source: Public Records
Tax History Compared to Growth
Tax History
| Year | Tax Paid | Tax Assessment Tax Assessment Total Assessment is a certain percentage of the fair market value that is determined by local assessors to be the total taxable value of land and additions on the property. | Land | Improvement |
|---|---|---|---|---|
| 2025 | $1,336 | $82,616 | $42,272 | $40,344 |
| 2024 | $1,336 | $80,997 | $41,444 | $39,553 |
| 2023 | $1,313 | $79,410 | $40,632 | $38,778 |
| 2022 | $1,256 | $77,854 | $39,836 | $38,018 |
| 2021 | $1,237 | $76,328 | $39,055 | $37,273 |
| 2019 | $1,199 | $74,066 | $37,898 | $36,168 |
| 2018 | $1,114 | $72,614 | $37,155 | $35,459 |
| 2016 | $1,045 | $69,796 | $35,713 | $34,083 |
| 2015 | $1,026 | $68,749 | $35,177 | $33,572 |
| 2014 | $1,029 | $67,403 | $34,488 | $32,915 |
Source: Public Records
Map
Nearby Homes
- 13204 S Wilton Place
- 1819 W 129th St
- 1618 W 132nd St Unit 17
- 13115 Spinning Ave
- 13709 Spinning Ave
- 13404 Arcturus Ave
- 13621 Arcturus Ave
- 13228 S Wilkie Ave
- 2611 W 129th St
- 1736 W 144th St
- 1349 W 135th St Unit 21
- 1617 W 125th St
- 13919 S Normandie Ave Unit 20
- 1730 W 145th St Unit 9I
- 13628 S Mariposa Ave
- 2911 W 129th St
- 1448 Azalea Cir
- 1261 139th St
- 1549 W 146th St Unit 9
- 2018 W 147th St
- 13320 Ruthelen St
- 13328 Ruthelen St
- 13323 S Saint Andrews Place
- 13316 Ruthelen St
- 13332 Ruthelen St
- 13319 S Saint Andrews Place
- 13327 S Saint Andrews Place
- 13315 S Saint Andrews Place
- 13331 S Saint Andrews Place
- 13323 Ruthelen St
- 13312 Ruthelen St
- 13319 Ruthelen St
- 13327 Ruthelen St
- 13336 Ruthelen St
- 13315 Ruthelen St
- 13311 S Saint Andrews Place
- 13335 S Saint Andrews Place
- 13308 Ruthelen St
- 13311 Ruthelen St
- 13335 Ruthelen St