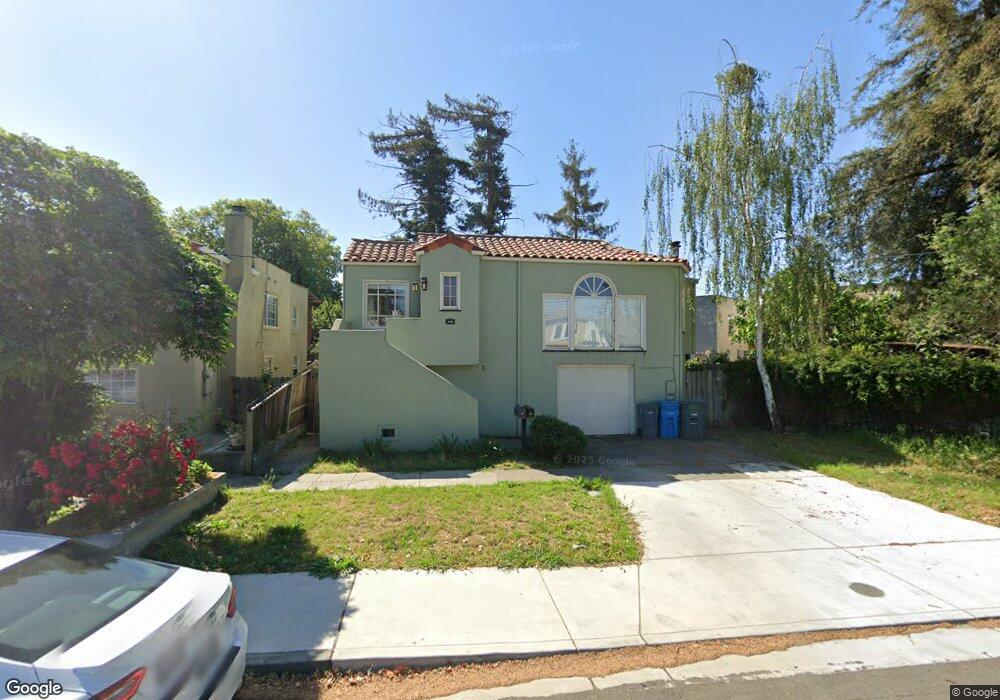
1333 Beach St Vallejo, CA 94590
West Vallejo NeighborhoodEstimated Value: $419,000 - $462,000
2
Beds
2
Baths
1,092
Sq Ft
$402/Sq Ft
Est. Value
About This Home
This home is located at 1333 Beach St, Vallejo, CA 94590 and is currently estimated at $439,056, approximately $402 per square foot. 1333 Beach St is a home located in Solano County with nearby schools including Steffan Manor Elementary, Vallejo High School, and Mustard Seed Preschool and Kindergarten.
Ownership History
Date
Name
Owned For
Owner Type
Purchase Details
Closed on
Aug 16, 2019
Sold by
Skinnell Kerri and Skinnell Christopher
Bought by
Lee Ronald N and Lee Dorothea
Current Estimated Value
Purchase Details
Closed on
Nov 15, 2013
Sold by
Skinnell Kerri and Skinnell Christopher
Bought by
Skinnell Kerri and Skinnell Christopher
Home Financials for this Owner
Home Financials are based on the most recent Mortgage that was taken out on this home.
Original Mortgage
$289,725
Interest Rate
4.18%
Mortgage Type
New Conventional
Purchase Details
Closed on
Jan 29, 2010
Sold by
Skinnell Christopher E and Skinnell Kerri
Bought by
Skinnell Kerri and Skinnell Christopher
Purchase Details
Closed on
Oct 29, 2004
Sold by
Skinnell Christopher E
Bought by
Skinnell Christopher E and Skinnell Kerri
Home Financials for this Owner
Home Financials are based on the most recent Mortgage that was taken out on this home.
Original Mortgage
$283,600
Interest Rate
5.37%
Mortgage Type
Purchase Money Mortgage
Purchase Details
Closed on
Oct 22, 2003
Sold by
Goff Thomas N
Bought by
Goff Thomas N
Home Financials for this Owner
Home Financials are based on the most recent Mortgage that was taken out on this home.
Original Mortgage
$115,000
Interest Rate
5.92%
Mortgage Type
Purchase Money Mortgage
Purchase Details
Closed on
Sep 8, 1995
Sold by
Goff Carol M
Bought by
Goff Thomas N
Home Financials for this Owner
Home Financials are based on the most recent Mortgage that was taken out on this home.
Original Mortgage
$93,952
Interest Rate
7.88%
Mortgage Type
FHA
Purchase Details
Closed on
Sep 6, 1995
Sold by
Demaintenon Carol J and Demaintenon Carol
Bought by
Goff Thomas N and Goff Thomas N
Home Financials for this Owner
Home Financials are based on the most recent Mortgage that was taken out on this home.
Original Mortgage
$93,952
Interest Rate
7.88%
Mortgage Type
FHA
Create a Home Valuation Report for This Property
The Home Valuation Report is an in-depth analysis detailing your home's value as well as a comparison with similar homes in the area
Home Values in the Area
Average Home Value in this Area
Purchase History
We collect this data history from publicly available records. To have your information removed, we recommend requesting removal directly through your county’s website.
| Date | Buyer | Sale Price | Title Company |
|---|---|---|---|
| Lee Ronald N | $266,500 | Old Republic Title Company | |
| Skinnell Kerri | -- | None Available | |
| Skinnell Kerri | -- | None Available | |
| Skinnell Kerri | -- | None Available | |
| Skinnell Christopher E | -- | North American Title Co | |
| Skinnell Christopher E | -- | North American Title Co | |
| Skinnell Christopher E | $354,500 | North American Title Co | |
| Goff Thomas N | $43,000 | First American Title Co | |
| Goff Thomas N | -- | -- | |
| Goff Thomas N | $94,000 | North American Title |
Source: Public Records
Mortgage History
We collect this data history from publicly available records. To have your information removed, we recommend requesting removal directly through your county’s website.
| Date | Status | Borrower | Loan Amount |
|---|---|---|---|
| Previous Owner | Skinnell Kerri | $289,725 | |
| Previous Owner | Skinnell Christopher E | $283,600 | |
| Previous Owner | Goff Thomas N | $115,000 | |
| Previous Owner | Goff Thomas N | $93,952 | |
| Closed | Skinnell Christopher E | $70,900 |
Source: Public Records
Tax History
| Year | Tax Paid | Tax Assessment Tax Assessment Total Assessment is a certain percentage of the fair market value that is determined by local assessors to be the total taxable value of land and additions on the property. | Land | Improvement |
|---|---|---|---|---|
| 2025 | $5,829 | $423,237 | $131,234 | $292,003 |
| 2024 | $5,829 | $414,939 | $128,661 | $286,278 |
| 2023 | $5,520 | $406,804 | $126,139 | $280,665 |
| 2022 | $5,437 | $398,828 | $123,667 | $275,161 |
| 2021 | $5,318 | $391,009 | $121,243 | $269,766 |
| 2020 | $5,357 | $387,000 | $120,000 | $267,000 |
| 2019 | $5,297 | $387,000 | $46,000 | $341,000 |
| 2018 | $4,637 | $350,000 | $45,000 | $305,000 |
| 2017 | $3,994 | $303,000 | $42,000 | $261,000 |
| 2016 | $3,039 | $263,000 | $39,000 | $224,000 |
| 2015 | $2,543 | $219,000 | $35,000 | $184,000 |
| 2014 | $2,362 | $202,000 | $34,000 | $168,000 |
Source: Public Records
Map
Nearby Homes
- 507 Central Ave
- 315 Evans Ave
- 1434 Beach St
- 321 Benicia Rd
- 227 Evans Ave
- 317 Central Ave
- 100 Gleason Ave
- 107 Mayo Ave
- 220 Perkins Ave
- 37 14th St
- 105 Phelan Ave
- 613 Georgia St
- 205 14th St
- 242 Phelan Ave
- 1039 Georgia St
- 316 Mayo Ave
- 904 Maine St
- 1210 Capitol St
- 410 San Gabriel Dr Unit 410
- 1020 Georgia St
Your Personal Tour Guide
Ask me questions while you tour the home.