Estimated Value: $176,000 - $194,000
3
Beds
2
Baths
933
Sq Ft
$195/Sq Ft
Est. Value
About This Home
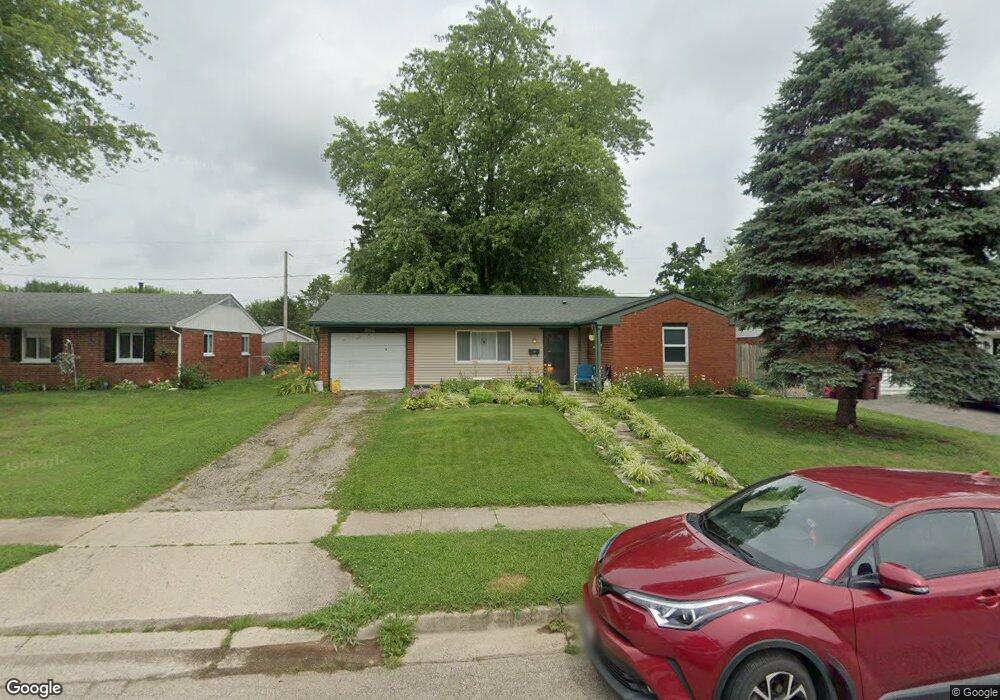
This home is located at 1333 Commonwealth Dr, Xenia, OH 45385 and is currently estimated at $181,836, approximately $194 per square foot. 1333 Commonwealth Dr is a home located in Greene County with nearby schools including Xenia High School and Summit Academy Community School for Alternative Learners - Xenia.
Ownership History
Date
Name
Owned For
Owner Type
Purchase Details
Closed on
Aug 22, 2011
Sold by
Ary Vonda F and Kingsolver Robert
Bought by
Ary Christopher J
Current Estimated Value
Purchase Details
Closed on
Dec 27, 2000
Sold by
Family Mtg Service Corp
Bought by
Ary Christopher J and Ary Vonda F
Home Financials for this Owner
Home Financials are based on the most recent Mortgage that was taken out on this home.
Original Mortgage
$72,862
Outstanding Balance
$25,222
Interest Rate
7.77%
Mortgage Type
FHA
Estimated Equity
$156,614
Purchase Details
Closed on
May 24, 2000
Sold by
Fields Charles E
Bought by
Family Mtg Service Corp
Purchase Details
Closed on
Mar 10, 2000
Sold by
Fields Charles E and Fields Penny Fields
Bought by
Family Mtg Service Corp #19
Purchase Details
Closed on
Mar 9, 2000
Sold by
Fields Charles E
Bought by
Family Mtg Service Corp #19
Create a Home Valuation Report for This Property
The Home Valuation Report is an in-depth analysis detailing your home's value as well as a comparison with similar homes in the area
Home Values in the Area
Average Home Value in this Area
Purchase History
| Date | Buyer | Sale Price | Title Company |
|---|---|---|---|
| Ary Christopher J | -- | Attorney | |
| Ary Christopher J | $72,900 | -- | |
| Family Mtg Service Corp | $52,000 | -- | |
| Family Mtg Service Corp #19 | $52,000 | -- | |
| Family Mtg Service Corp #19 | $52,000 | -- |
Source: Public Records
Mortgage History
| Date | Status | Borrower | Loan Amount |
|---|---|---|---|
| Open | Ary Christopher J | $72,862 |
Source: Public Records
Tax History
| Year | Tax Paid | Tax Assessment Tax Assessment Total Assessment is a certain percentage of the fair market value that is determined by local assessors to be the total taxable value of land and additions on the property. | Land | Improvement |
|---|---|---|---|---|
| 2025 | $1,845 | $42,360 | $10,680 | $31,680 |
| 2024 | $1,845 | $42,360 | $10,680 | $31,680 |
| 2023 | $1,812 | $42,360 | $10,680 | $31,680 |
| 2022 | $1,499 | $29,890 | $6,280 | $23,610 |
| 2021 | $1,520 | $29,890 | $6,280 | $23,610 |
| 2020 | $1,456 | $29,890 | $6,280 | $23,610 |
| 2019 | $1,268 | $24,510 | $6,240 | $18,270 |
| 2018 | $1,273 | $24,510 | $6,240 | $18,270 |
| 2017 | $1,237 | $24,510 | $6,240 | $18,270 |
| 2016 | $1,168 | $22,070 | $6,240 | $15,830 |
| 2015 | $1,172 | $22,070 | $6,240 | $15,830 |
| 2014 | $1,122 | $22,070 | $6,240 | $15,830 |
Source: Public Records
Map
Nearby Homes
- 2096 Alabama Dr
- 2015 Pennsylvania Dr
- 624 Georgia Dr
- 1715 Sioux Dr
- 1955 Roxbury Dr
- 2432 Harmony Dr
- 2352 Pembury Dr
- 1321 Massachusetts Dr
- 1540 Crockett Ct
- 2516 Jenny Marie Dr
- 1001 Glen Kegley Dr
- 0 Berkshire Dr Unit 949217
- 1182 Bellbrook Ave
- 1577 W 2nd St
- 779 Buckskin Trail
- 2795 Kingman Dr
- 1408 W 2nd St
- 2936 W Barnhill Place
- 1529 Bowman Dr
- 1198 Prem Place
- 1347 Commonwealth Dr
- 1319 Commonwealth Dr
- 1305 Commonwealth Dr
- 1361 Commonwealth Dr
- 3272 Wyoming Dr
- 3286 Wyoming Dr
- 1320 Commonwealth Dr
- 1334 Commonwealth Dr
- 1306 Commonwealth Dr
- 1841 Nebraska Dr
- 1861 Nebraska Dr
- 3300 Wyoming Dr
- 1348 Commonwealth Dr
- 1379 Commonwealth Dr
- 1291 Commonwealth Dr
- 3258 Wyoming Dr
- 1917 Nebraska Dr
- 1362 Commonwealth Dr
- 1829 Nebraska Dr
- 1399 Commonwealth Dr
Your Personal Tour Guide
Ask me questions while you tour the home.