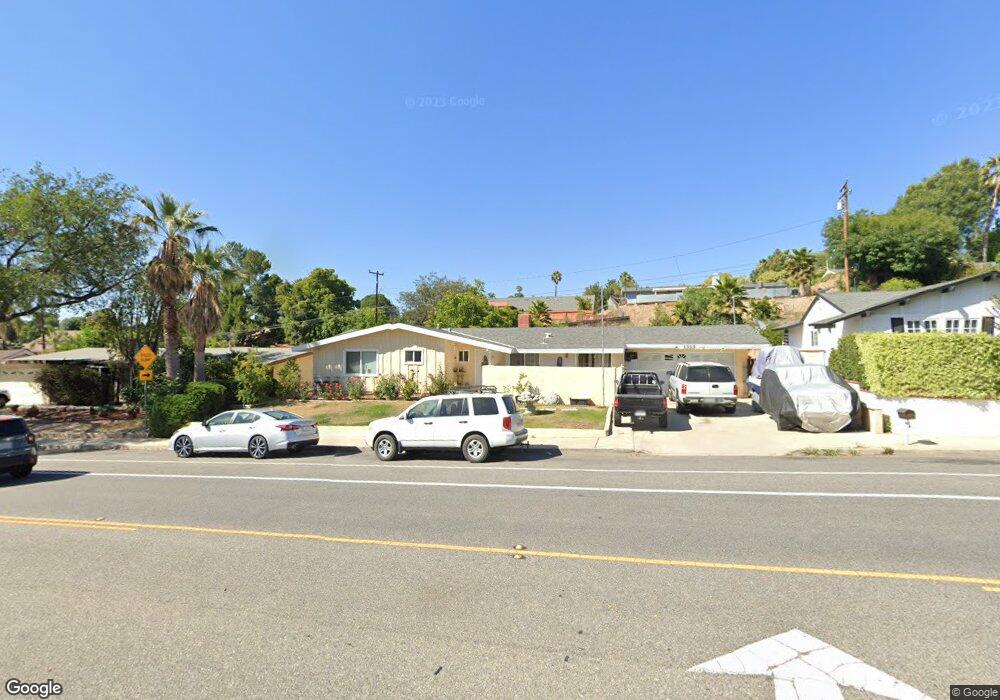
1333 E Avenida de Los Arboles Thousand Oaks, CA 91360
Estimated Value: $844,000 - $912,000
3
Beds
2
Baths
1,353
Sq Ft
$647/Sq Ft
Est. Value
About This Home
This home is located at 1333 E Avenida de Los Arboles, Thousand Oaks, CA 91360 and is currently estimated at $875,957, approximately $647 per square foot. 1333 E Avenida de Los Arboles is a home located in Ventura County with nearby schools including Ladera Stars Academy, Los Cerritos Middle School, and Thousand Oaks High School.
Ownership History
Date
Name
Owned For
Owner Type
Purchase Details
Closed on
Feb 11, 2021
Sold by
Gonzalez Pablo Gerardo Hernandez
Bought by
Rojas Claudia Janeth Zuniga
Current Estimated Value
Purchase Details
Closed on
Sep 25, 2003
Sold by
Maguire Pamela R
Bought by
Zuniga Juan and Rojas Lourdes
Home Financials for this Owner
Home Financials are based on the most recent Mortgage that was taken out on this home.
Original Mortgage
$364,500
Outstanding Balance
$167,643
Interest Rate
6%
Mortgage Type
Purchase Money Mortgage
Estimated Equity
$708,314
Purchase Details
Closed on
Oct 20, 1999
Sold by
Arnold Alma N
Bought by
Maguire Pamela R
Home Financials for this Owner
Home Financials are based on the most recent Mortgage that was taken out on this home.
Original Mortgage
$168,000
Interest Rate
8.5%
Mortgage Type
Balloon
Create a Home Valuation Report for This Property
The Home Valuation Report is an in-depth analysis detailing your home's value as well as a comparison with similar homes in the area
Home Values in the Area
Average Home Value in this Area
Purchase History
| Date | Buyer | Sale Price | Title Company |
|---|---|---|---|
| Rojas Claudia Janeth Zuniga | -- | Accommodation | |
| Zuniga Juan | -- | Accommodation | |
| Zuniga Juan | $406,000 | First American Title Co | |
| Maguire Pamela R | $210,000 | First American Title Ins Co |
Source: Public Records
Mortgage History
| Date | Status | Borrower | Loan Amount |
|---|---|---|---|
| Open | Zuniga Juan | $364,500 | |
| Previous Owner | Maguire Pamela R | $168,000 | |
| Closed | Maguire Pamela R | $42,000 |
Source: Public Records
Tax History Compared to Growth
Tax History
| Year | Tax Paid | Tax Assessment Tax Assessment Total Assessment is a certain percentage of the fair market value that is determined by local assessors to be the total taxable value of land and additions on the property. | Land | Improvement |
|---|---|---|---|---|
| 2025 | $6,373 | $575,809 | $287,906 | $287,903 |
| 2024 | $6,373 | $564,519 | $282,261 | $282,258 |
| 2023 | $6,122 | $553,450 | $276,726 | $276,724 |
| 2022 | $6,012 | $542,599 | $271,300 | $271,299 |
| 2021 | $5,908 | $531,960 | $265,980 | $265,980 |
| 2020 | $5,536 | $526,506 | $263,253 | $263,253 |
| 2019 | $5,389 | $516,184 | $258,092 | $258,092 |
| 2018 | $5,281 | $506,064 | $253,032 | $253,032 |
| 2017 | $5,178 | $496,142 | $248,071 | $248,071 |
| 2016 | $5,129 | $486,414 | $243,207 | $243,207 |
| 2015 | $5,039 | $479,108 | $239,554 | $239,554 |
| 2014 | $4,179 | $395,000 | $198,000 | $197,000 |
Source: Public Records
Map
Nearby Homes
- 1322 E Avenida de Los Arboles
- 1373 Calle Crisantemo
- 1356 Calle Crisantemo
- 1455 Calle Tulipan
- 970 Calle Nogal
- 1233 Calle Pensamiento
- 2965 Dogwood Cir
- 2961 Ponderosa Cir
- 1541 Eucalyptus Cir
- 1534 Holly Ct
- 1540 Holly Ct
- 1546 Holly Ct
- 2660 Calle Abedul
- 960 Calle Margarita
- 1669 Woodside Dr
- 2847 Cedar Wood Place
- 823 Calle Margarita
- 731 Calle Nogal
- 1449 Calle Durazno
- 1764 Shady Brook Dr
- 1341 E Avenida de Los Arboles
- 1327 E Avenida de Los Arboles
- 1342 Calle Pimiento
- 1336 Calle Pimiento
- 1347 E Avenida de Los Arboles
- 1319 E Avenida de Los Arboles
- 1350 Calle Pimiento
- 1328 Calle Pimiento
- 1330 E Avenida de Los Arboles
- 1336 E Avenida de Los Arboles
- 1356 Calle Pimiento
- 1322 Calle Pimiento
- 1344 E Avenida de Los Arboles
- 1355 E Avenida de Los Arboles
- 1311 E Avenida de Los Arboles
- 1314 E Avenida de Los Arboles
- 1354 E Avenida de Los Arboles
- 1341 Calle Pimiento
- 1364 Calle Pimiento
- 1314 Calle Pimiento