1333 Kains Ave Berkeley, CA 94702
West Berkeley NeighborhoodEstimated Value: $1,048,000 - $2,037,000
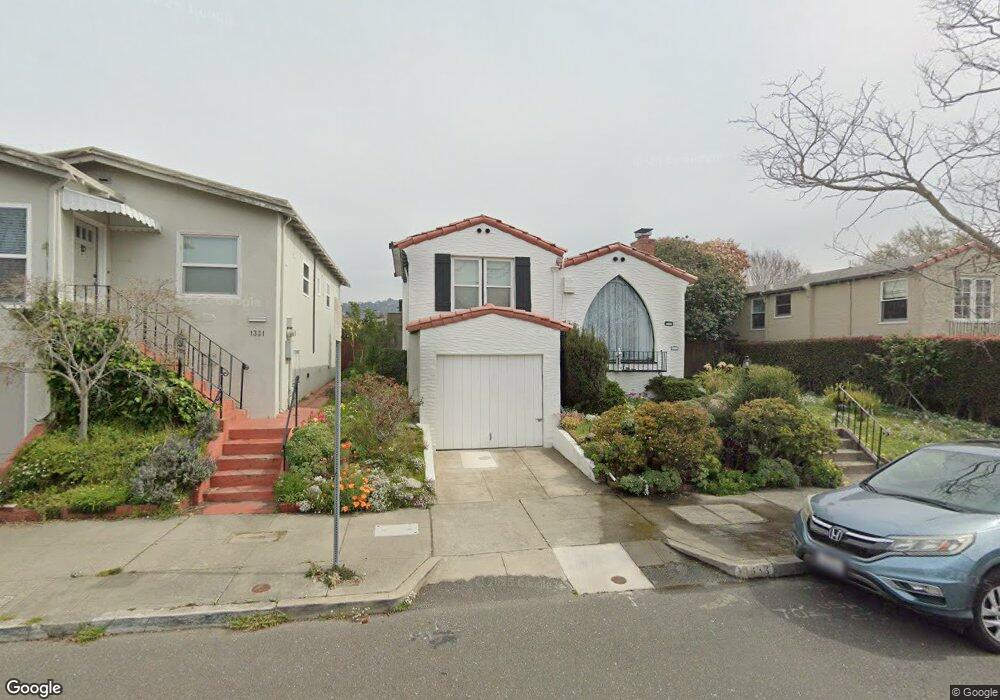
About This Home
This home is located at 1333 Kains Ave, Berkeley, CA 94702 and is currently estimated at $1,682,965, approximately $867 per square foot. 1333 Kains Ave is a home located in Alameda County with nearby schools including Ruth Acty Elementary, Rosa Parks Elementary School, and Thousand Oaks Elementary School.
Ownership History
We collect this data history from publicly available records. To have your information removed, we recommend requesting removal directly through your county’s website.
Purchase Details
Home Financials for this Owner
Home Financials are based on the most recent Mortgage that was taken out on this home.Home Values in the Area
Average Home Value in this Area
Purchase History
We collect this data history from publicly available records. To have your information removed, we recommend requesting removal directly through your county’s website.
| Date | Buyer | Sale Price | Title Company |
|---|---|---|---|
| $211,500 | Fidelity National Title Ins |
Mortgage History
We collect this data history from publicly available records. To have your information removed, we recommend requesting removal directly through your county’s website.
| Date | Status | Borrower | Loan Amount |
|---|---|---|---|
| Previous Owner | $190,350 |
Tax History
We collect this data history from publicly available records. To have your information removed, we recommend requesting removal directly through your county’s website.
| Year | Tax Paid | Tax Assessment Tax Assessment Total Assessment is a certain percentage of the fair market value that is determined by local assessors to be the total taxable value of land and additions on the property. | Land | Improvement |
|---|---|---|---|---|
| 2025 | $8,099 | $344,334 | $105,483 | $245,851 |
| 2024 | $8,099 | $337,446 | $103,415 | $241,031 |
| 2023 | $7,849 | $337,692 | $101,387 | $236,305 |
| 2022 | $7,594 | $324,073 | $99,400 | $231,673 |
| 2021 | $7,576 | $317,582 | $97,451 | $227,131 |
| 2020 | $7,070 | $321,255 | $96,452 | $224,803 |
| 2019 | $6,673 | $314,956 | $94,561 | $220,395 |
| 2018 | $6,518 | $308,783 | $92,708 | $216,075 |
| 2017 | $6,269 | $302,729 | $90,890 | $211,839 |
| 2016 | $5,971 | $296,794 | $89,108 | $207,686 |
| 2015 | $5,870 | $292,338 | $87,770 | $204,568 |
| 2014 | $5,782 | $286,614 | $86,052 | $200,562 |
Map
- 1175 Camelia St
- 1213 San Pablo Ave
- 1470 Cornell Ave
- 1192 Kains Ave
- 936 Camelia St
- 1313 Curtis St
- 1229 Hopkins St
- 1418 #2 Northside Ave
- 1419 Northside Ave Unit B
- 1412 8th St
- 1504 10th St
- 1316 Peralta Ave
- 1120 Masonic Ave
- 916 Bataan Ave
- 1059 Talbot Ave
- 1037 Stannage Ave
- 817 Jones St
- 809 Jones St
- 1034 Evelyn Ave
- 1735 Tenth St
- 1331 Kains Ave
- 1335 Kains Ave
- 1327 Kains Ave
- 1323 Kains Ave
- 1330 Stannage Ave
- 1334 Stannage Ave
- 1328 Stannage Ave
- 1324 Stannage Ave
- 1336 Stannage Ave
- 1321 Kains Ave
- 1343 Kains Ave
- 1322 Stannage Ave
- 1338 Stannage Ave
- 1330 Kains Ave
- 1328 Kains Ave
- 1332 Kains Ave
- 1320 Stannage Ave
- 1319 Kains Ave
- 1326 Kains Ave
- 1350 Stannage Ave
Ask me questions while you tour the home.