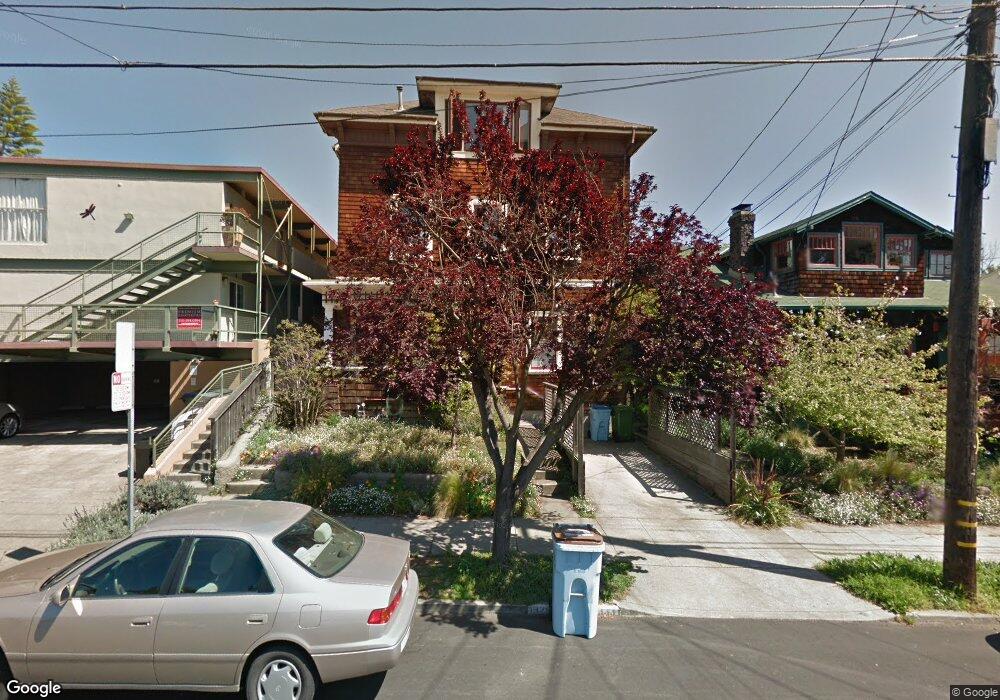
1333 Milvia St Unit A Berkeley, CA 94709
North Berkeley NeighborhoodEstimated Value: $917,482 - $1,156,000
2
Beds
1
Bath
1,167
Sq Ft
$887/Sq Ft
Est. Value
About This Home
This home is located at 1333 Milvia St Unit A, Berkeley, CA 94709 and is currently estimated at $1,035,371, approximately $887 per square foot. 1333 Milvia St Unit A is a home located in Alameda County with nearby schools including Berkeley Arts Magnet at Whittier School, Cragmont Elementary School, and Washington Elementary School.
Ownership History
Date
Name
Owned For
Owner Type
Purchase Details
Closed on
Nov 27, 2017
Sold by
Silverman David H
Bought by
Silverman David H
Current Estimated Value
Purchase Details
Closed on
Jul 22, 1997
Sold by
Baar Kenneth K
Bought by
Silverman David H
Home Financials for this Owner
Home Financials are based on the most recent Mortgage that was taken out on this home.
Original Mortgage
$25,000
Interest Rate
7.7%
Mortgage Type
Purchase Money Mortgage
Purchase Details
Closed on
Aug 6, 1993
Sold by
Baar Kenneth K and Baar Toni S
Bought by
Baar Kenneth K
Create a Home Valuation Report for This Property
The Home Valuation Report is an in-depth analysis detailing your home's value as well as a comparison with similar homes in the area
Home Values in the Area
Average Home Value in this Area
Purchase History
| Date | Buyer | Sale Price | Title Company |
|---|---|---|---|
| Silverman David H | -- | None Available | |
| Silverman David H | $205,000 | Old Republic Title Company | |
| Baar Kenneth K | -- | -- |
Source: Public Records
Mortgage History
| Date | Status | Borrower | Loan Amount |
|---|---|---|---|
| Closed | Silverman David H | $25,000 |
Source: Public Records
Tax History
| Year | Tax Paid | Tax Assessment Tax Assessment Total Assessment is a certain percentage of the fair market value that is determined by local assessors to be the total taxable value of land and additions on the property. | Land | Improvement |
|---|---|---|---|---|
| 2025 | $5,978 | $320,317 | $98,195 | $229,122 |
| 2024 | $5,978 | $313,900 | $96,270 | $224,630 |
| 2023 | $5,841 | $314,608 | $94,382 | $220,226 |
| 2022 | $5,710 | $301,440 | $92,532 | $215,908 |
| 2021 | $5,705 | $295,393 | $90,718 | $211,675 |
| 2020 | $5,349 | $299,293 | $89,788 | $209,505 |
| 2019 | $5,082 | $293,426 | $88,028 | $205,398 |
| 2018 | $4,981 | $287,674 | $86,302 | $201,372 |
| 2017 | $4,789 | $282,034 | $84,610 | $197,424 |
| 2016 | $4,592 | $276,505 | $82,951 | $193,554 |
| 2015 | $4,524 | $272,351 | $81,705 | $190,646 |
| 2014 | $4,477 | $267,018 | $80,105 | $186,913 |
Source: Public Records
Map
Nearby Homes
- 1408 Henry St
- 1425 Martin Luther King jr Way
- 1444 Walnut St
- 1950 Hopkins St
- 2121 Eunice St
- 1610 Milvia St
- 1609 Bonita Ave Unit 5
- 1515 Oxford St Unit 1D
- 1625 Martin Luther King jr Way
- 1808 Cedar St
- 1626 Hopkins St
- 1682 Oxford St
- 2315 Eunice St
- 2201 Virginia St Unit 2
- 1622 Scenic Ave
- 1739 Spruce St
- 2421 Hilgard Ave
- 2501 Rose Walk
- 2340 Virginia St
- 1004 Cragmont Ave
- 1331 Milvia St Unit C
- 1329 Milvia St Unit B
- 1327 Milvia St
- 1335 Milvia St
- 1325 Milvia St
- 1339 Milvia St
- 1341 Milvia St
- 1330 Milvia St
- 1321 Milvia St
- 1321 Milvia St Unit 1321
- 1360 Henry St
- 1376 Henry St
- 1336 Milvia St Unit B
- 1336 Milvia St Unit A
- 1338 Milvia St
- 1338 Milvia St Unit A
- 1336 Milvia St
- 1326 Milvia St Unit D
- 1326 Milvia St Unit B
- 1326 Milvia St Unit C
Your Personal Tour Guide
Ask me questions while you tour the home.