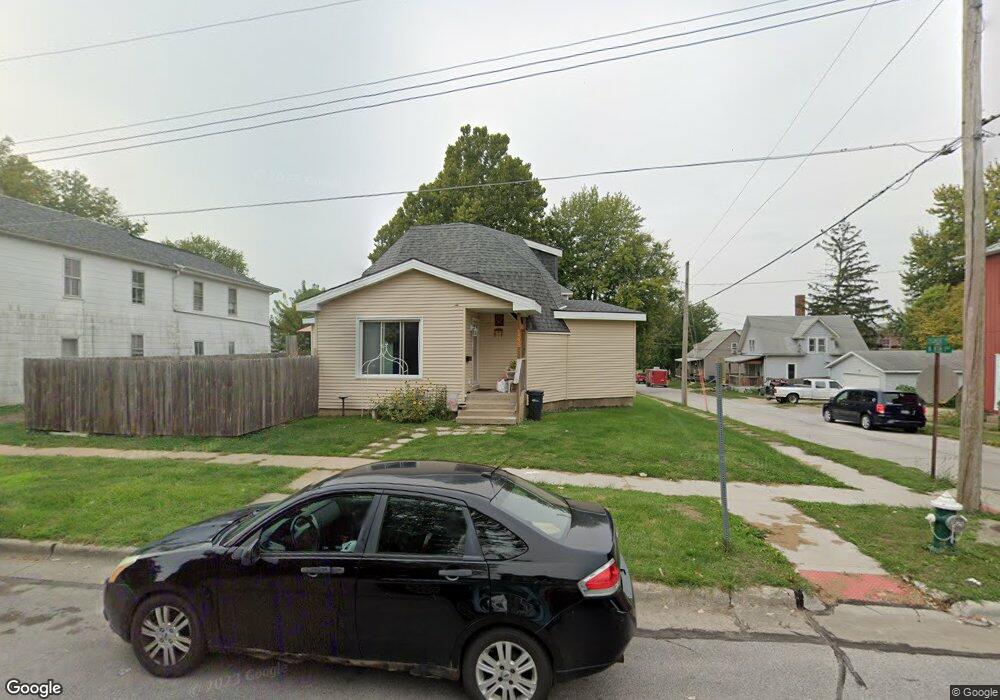
1333 N 8th St Burlington, IA 52601
Estimated Value: $82,000 - $107,000
2
Beds
1
Bath
1,296
Sq Ft
$72/Sq Ft
Est. Value
About This Home
This home is located at 1333 N 8th St, Burlington, IA 52601 and is currently estimated at $93,204, approximately $71 per square foot. 1333 N 8th St is a home located in Des Moines County with nearby schools including Burlington Community High School, Great River Christian School, and Burlington Christian School.
Ownership History
Date
Name
Owned For
Owner Type
Purchase Details
Closed on
Dec 31, 2018
Sold by
Burlington Paradise Inc
Bought by
Shimmin Tyler E and Star-Shimmin Melody
Current Estimated Value
Home Financials for this Owner
Home Financials are based on the most recent Mortgage that was taken out on this home.
Original Mortgage
$74,000
Outstanding Balance
$65,196
Interest Rate
4.8%
Mortgage Type
New Conventional
Estimated Equity
$28,008
Purchase Details
Closed on
Jun 17, 2014
Sold by
Meyer Ralph E and Meyer Darla J
Bought by
Farmers & Merchants Bank & Trust
Create a Home Valuation Report for This Property
The Home Valuation Report is an in-depth analysis detailing your home's value as well as a comparison with similar homes in the area
Home Values in the Area
Average Home Value in this Area
Purchase History
| Date | Buyer | Sale Price | Title Company |
|---|---|---|---|
| Shimmin Tyler E | $55,000 | -- | |
| Farmers & Merchants Bank & Trust | -- | None Available |
Source: Public Records
Mortgage History
| Date | Status | Borrower | Loan Amount |
|---|---|---|---|
| Open | Shimmin Tyler E | $74,000 |
Source: Public Records
Tax History Compared to Growth
Tax History
| Year | Tax Paid | Tax Assessment Tax Assessment Total Assessment is a certain percentage of the fair market value that is determined by local assessors to be the total taxable value of land and additions on the property. | Land | Improvement |
|---|---|---|---|---|
| 2025 | $1,520 | $89,900 | $8,100 | $81,800 |
| 2024 | $1,520 | $78,200 | $8,100 | $70,100 |
| 2023 | $1,490 | $78,200 | $8,100 | $70,100 |
| 2022 | $1,512 | $74,300 | $8,100 | $66,200 |
| 2021 | $1,512 | $74,300 | $8,100 | $66,200 |
| 2020 | $1,612 | $74,300 | $8,100 | $66,200 |
| 2019 | $1,768 | $74,300 | $8,100 | $66,200 |
| 2018 | $1,770 | $76,800 | $8,200 | $68,600 |
| 2017 | $1,770 | $74,400 | $0 | $0 |
| 2016 | $1,694 | $74,400 | $0 | $0 |
| 2015 | $1,694 | $74,400 | $0 | $0 |
| 2014 | $1,716 | $73,200 | $0 | $0 |
Source: Public Records
Map
Nearby Homes