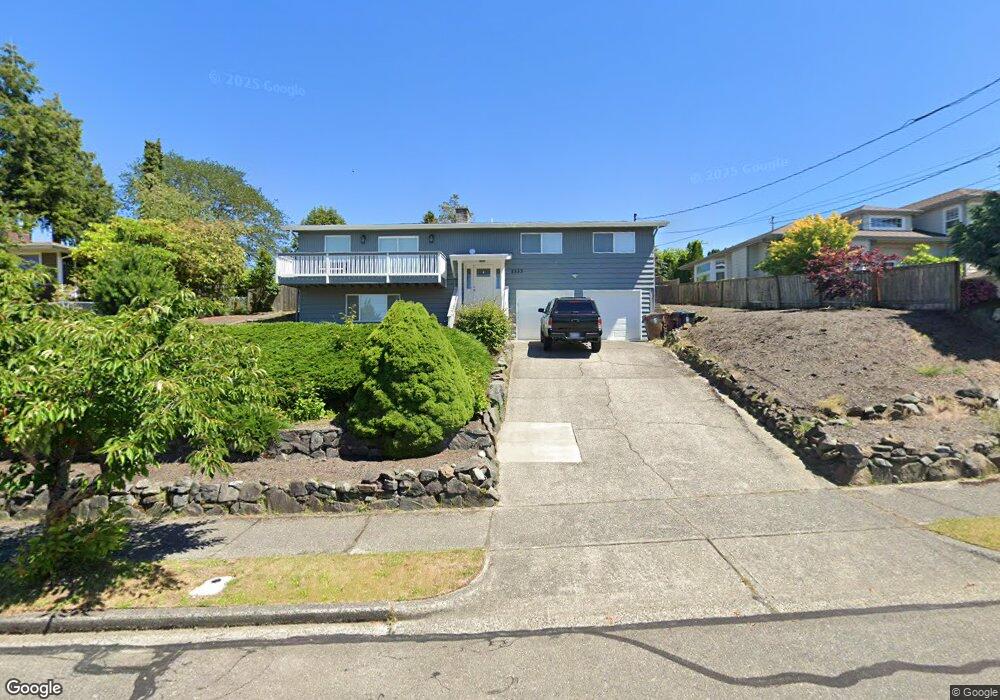
1333 N Heatherwood West Tacoma, WA 98406
North Tacoma NeighborhoodEstimated Value: $664,574 - $731,000
3
Beds
3
Baths
1,444
Sq Ft
$491/Sq Ft
Est. Value
About This Home
This home is located at 1333 N Heatherwood West, Tacoma, WA 98406 and is currently estimated at $709,644, approximately $491 per square foot. 1333 N Heatherwood West is a home located in Pierce County with nearby schools including Skyline Elementary School, Truman Middle School, and Dr. Dolores Silas High School.
Ownership History
Date
Name
Owned For
Owner Type
Purchase Details
Closed on
Mar 31, 2020
Sold by
Jmcdm Llc
Bought by
Luu Dustin and Chhuor Muy C
Current Estimated Value
Home Financials for this Owner
Home Financials are based on the most recent Mortgage that was taken out on this home.
Original Mortgage
$405,600
Outstanding Balance
$359,312
Interest Rate
3.4%
Mortgage Type
New Conventional
Estimated Equity
$350,332
Purchase Details
Closed on
Feb 20, 2019
Sold by
Stamper Heather M and Stamper Keith
Bought by
Jmcdm Llc and Eastside Funding Llc
Purchase Details
Closed on
Feb 1, 2019
Sold by
Eastside Funding Llc
Bought by
Jmcdm Llc
Purchase Details
Closed on
Mar 14, 2006
Sold by
Furness Valerie
Bought by
Stamper Keith H and Stamper Heather M
Home Financials for this Owner
Home Financials are based on the most recent Mortgage that was taken out on this home.
Original Mortgage
$252,000
Interest Rate
6.25%
Mortgage Type
Fannie Mae Freddie Mac
Create a Home Valuation Report for This Property
The Home Valuation Report is an in-depth analysis detailing your home's value as well as a comparison with similar homes in the area
Home Values in the Area
Average Home Value in this Area
Purchase History
| Date | Buyer | Sale Price | Title Company |
|---|---|---|---|
| Luu Dustin | -- | Fidelity National Title | |
| Jmcdm Llc | $325,000 | None Available | |
| Jmcdm Llc | -- | None Available | |
| Stamper Keith H | $315,000 | Ticor |
Source: Public Records
Mortgage History
| Date | Status | Borrower | Loan Amount |
|---|---|---|---|
| Open | Luu Dustin | $405,600 | |
| Previous Owner | Stamper Keith H | $252,000 |
Source: Public Records
Tax History Compared to Growth
Tax History
| Year | Tax Paid | Tax Assessment Tax Assessment Total Assessment is a certain percentage of the fair market value that is determined by local assessors to be the total taxable value of land and additions on the property. | Land | Improvement |
|---|---|---|---|---|
| 2025 | $6,126 | $612,200 | $299,800 | $312,400 |
| 2024 | $6,126 | $596,600 | $299,800 | $296,800 |
| 2023 | $6,126 | $550,500 | $275,600 | $274,900 |
| 2022 | $5,386 | $607,700 | $301,000 | $306,700 |
| 2021 | $5,133 | $408,500 | $182,300 | $226,200 |
| 2019 | $5,015 | $394,100 | $169,600 | $224,500 |
| 2018 | $5,442 | $386,100 | $152,600 | $233,500 |
| 2017 | $4,911 | $344,700 | $130,300 | $214,400 |
| 2016 | $4,138 | $259,700 | $90,100 | $169,600 |
| 2014 | $3,645 | $238,100 | $78,900 | $159,200 |
| 2013 | $3,645 | $214,400 | $70,700 | $143,700 |
Source: Public Records
Map
Nearby Homes
- 1142 N Skyline Dr
- 1122 N Skyline Dr
- 1126 N Jackson Ave
- 1516 N Jackson Ave
- 1307 N Cascade Ave
- 1120 N Jackson Ave
- 1116 N Jackson Ave
- 1730 N Narrows Dr
- 7613 N 10th St
- 7517 N 10th St
- 1741 N Jackson Ave
- 7310 N Skyview Ln Unit 301
- 1372 Bel Air Rd Unit 23
- 7304 N Skyview Place Unit A-103
- 1845 N Hawthorne Dr
- 625 N Jackson Ave Unit D4
- 625 N Jackson Ave Unit C24
- 625 N Jackson Ave Unit A15
- 7848 N Woodworth Ave
- 640 Vista Dr
- 1327 N Heatherwood West
- 1339 N Heatherwood West
- 1339 N Heatherwood W
- 1330 Bridgeview Dr
- 1336 Bridgeview Dr
- 1330 N Heatherwood W
- 1321 N Heatherwood West
- 1324 Bridgeview Dr
- 1347 N Heatherwood West
- 1326 N Heatherwood W
- 1332 N Heatherwood W
- 1342 Bridgeview Dr
- 1322 N Heatherwood W
- 1316 Bridgeview Dr
- 1315 N Heatherwood West
- 1315 N Heatherwood W
- 1340 N Heatherwood W
- 1507 N James St
- 1353 N Heatherwood West
- 1353 N Heatherwood W