About This Home
Please note, our homes are available on a first-come, first-serve basis and are not reserved until the holding fee agreement is signed and the holding fee is paid by the primary applicant.
Coming soon! This home is currently being enjoyed by another resident but will be available soon. Please respect their privacy and do not disturb. You can complete the application process and reserve this home for a $500 non-refundable holding fee until it's ready for move-in. This fee must be paid within 24 hours of being pre-qualified and will be applied to your first month’s rent if you enter into a lease for this home.
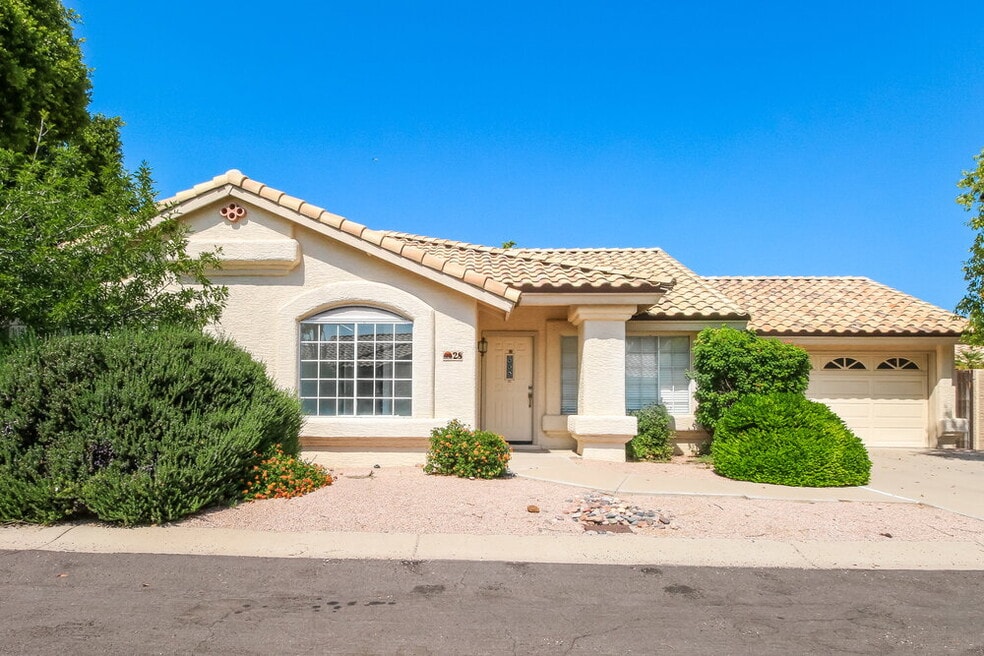
Interested in this home? You clearly have exceptional taste. This charming 3-bedroom, 2-bathroom home is not only pet-friendly, but also equipped with smart home features to make everyday life more convenient and connected. Homes like this don’t stay on the market for long—don’t miss your chance to make it yours. Apply today!

Map
- 5403 E Greenway St
- 5322 E Fountain St
- 1414 N Banning
- 5038 E Glencove St
- 1044 N Arvada
- 4949 E Gary St
- 1543 N Banning
- 965 N Arvada
- 5211 E Elmwood Cir
- 5345 E Elmwood St
- 5136 E Evergreen St Unit 1031
- 5136 E Evergreen St Unit 1117
- 5136 E Evergreen St Unit 1090
- 5136 E Evergreen St Unit 1053
- 5136 E Evergreen St Unit 1105
- 5345 E Mclellan Rd Unit 119
- 5345 E Mclellan Rd Unit 59
- 5345 E Mclellan Rd Unit 5
- 852 N Arvada
- 5505 E Mclellan Rd Unit 98
- 1508 N Balboa
- 1033 N Arvada
- 5136 E Evergreen St Unit 1053
- 5345 E Mclellan Rd Unit 112
- 5505 E Mclellan Rd Unit 56
- 5610 E Elmwood St
- 5808 E Brown Rd Unit 146
- 4811 E Fairfield St
- 5450 E Mclellan Rd Unit 216
- 5450 E Mclellan Rd Unit 209
- 5450 E Mclellan Rd Unit 212
- 5450 E Mclellan Rd Unit 147
- 1340 N Recker Rd Unit 209
- 1340 N Recker Rd Unit 323
- 1340 N Recker Rd Unit 245
- 5440 E Des Moines St
- 1340 N Recker Rd Unit Ariva
- 1444 N Recker Rd Unit 163
- 1444 N Recker Rd Unit 118
- 1444 N Recker Rd Unit 132