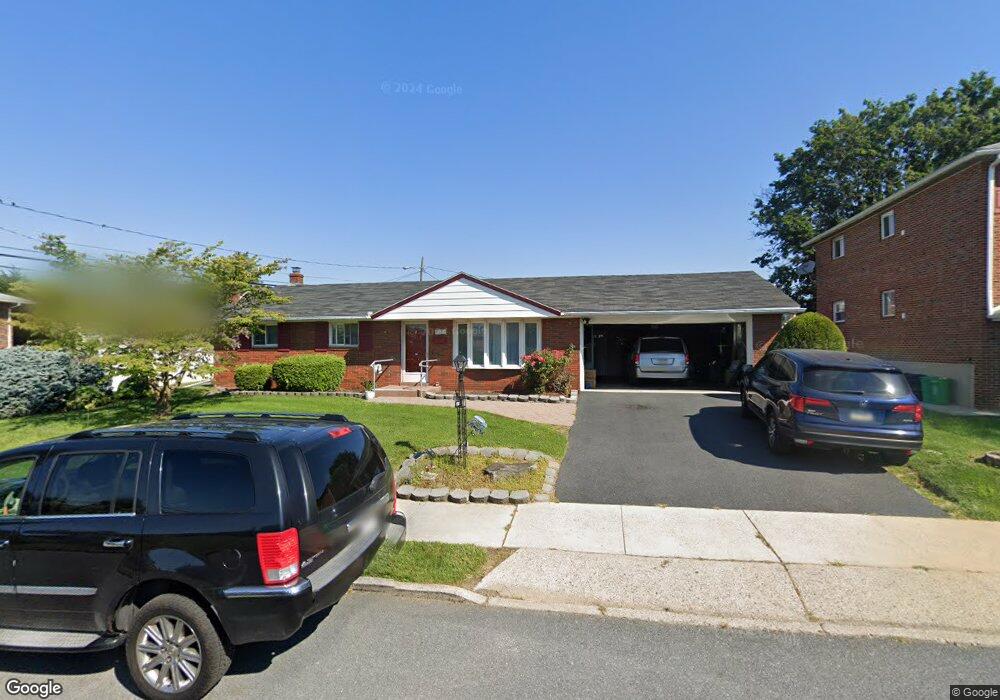
1333 W Tremont St Unit 1339 Allentown, PA 18102
Highland Park NeighborhoodEstimated Value: $279,000 - $331,915
3
Beds
2
Baths
1,134
Sq Ft
$273/Sq Ft
Est. Value
About This Home
This home is located at 1333 W Tremont St Unit 1339, Allentown, PA 18102 and is currently estimated at $309,729, approximately $273 per square foot. 1333 W Tremont St Unit 1339 is a home located in Lehigh County with nearby schools including Muhlenberg Elementary School, San Rafael Junior High School, and Trexler Middle School.
Ownership History
Date
Name
Owned For
Owner Type
Purchase Details
Closed on
Jun 11, 2007
Sold by
Via Of The Lehigh Valley
Bought by
Community Services Group
Current Estimated Value
Home Financials for this Owner
Home Financials are based on the most recent Mortgage that was taken out on this home.
Original Mortgage
$146,320
Outstanding Balance
$89,532
Interest Rate
6.19%
Mortgage Type
New Conventional
Estimated Equity
$220,197
Purchase Details
Closed on
Oct 29, 2003
Sold by
Durishin Eleanor D
Bought by
Via Of The Lehigh Valley Inc
Home Financials for this Owner
Home Financials are based on the most recent Mortgage that was taken out on this home.
Original Mortgage
$142,500
Interest Rate
6.05%
Mortgage Type
Stand Alone Second
Purchase Details
Closed on
Sep 16, 1993
Sold by
Riepensell Jr Gene J
Bought by
Jimenez Jose R and Jimenez Margarita
Purchase Details
Closed on
Feb 19, 1988
Bought by
Riepensell Gene J
Create a Home Valuation Report for This Property
The Home Valuation Report is an in-depth analysis detailing your home's value as well as a comparison with similar homes in the area
Home Values in the Area
Average Home Value in this Area
Purchase History
| Date | Buyer | Sale Price | Title Company |
|---|---|---|---|
| Community Services Group | $182,900 | -- | |
| Via Of The Lehigh Valley Inc | $142,500 | -- | |
| Jimenez Jose R | $105,000 | -- | |
| Riepensell Gene J | $100,000 | -- |
Source: Public Records
Mortgage History
| Date | Status | Borrower | Loan Amount |
|---|---|---|---|
| Open | Community Services Group | $146,320 | |
| Previous Owner | Via Of The Lehigh Valley Inc | $142,500 |
Source: Public Records
Tax History Compared to Growth
Tax History
| Year | Tax Paid | Tax Assessment Tax Assessment Total Assessment is a certain percentage of the fair market value that is determined by local assessors to be the total taxable value of land and additions on the property. | Land | Improvement |
|---|---|---|---|---|
| 2025 | $4,910 | $140,800 | $29,500 | $111,300 |
| 2024 | $4,910 | $140,800 | $29,500 | $111,300 |
| 2023 | $4,910 | $140,800 | $29,500 | $111,300 |
| 2022 | $4,750 | $140,800 | $111,300 | $29,500 |
| 2021 | $4,662 | $140,800 | $29,500 | $111,300 |
| 2020 | $4,549 | $140,800 | $29,500 | $111,300 |
| 2019 | $4,480 | $140,800 | $29,500 | $111,300 |
| 2018 | $4,135 | $140,800 | $29,500 | $111,300 |
| 2017 | $4,037 | $140,800 | $29,500 | $111,300 |
| 2016 | -- | $140,800 | $29,500 | $111,300 |
| 2015 | -- | $140,800 | $29,500 | $111,300 |
| 2014 | -- | $140,800 | $29,500 | $111,300 |
Source: Public Records
Map
Nearby Homes
- 1235 Livingston St
- 1417 W Woodlawn St Unit 1431
- 1613 W Congress St Unit 1619
- 753 N 11th St
- 1717 W Cedar St
- 719 1/2 N 11th St
- 719 N 11th St
- 1038 W Green St
- 638 N 16th St
- 746 N 10th St
- 631 N Poplar St
- 615 N 12th St
- 605 N 16th St
- 605 1/2 N 16th St
- 739 N Hazel St
- 1802 W Washington St
- 1144 W Allen St
- 917 W Washington St
- 1010 W Tilghman St
- 1357 W Liberty St
- 1329 W Tremont St
- 1329 W Tremont St Unit C
- 1329 W Tremont St Unit C
- 1329 W Tremont St Unit 1
- 1027 N 14th St Unit 1031
- 1033 N 14th St Unit 1039
- 1323 W Tremont St
- 1323 W Tremont St Unit B
- 1323 W Tremont St Unit C
- 1035 N 14th St
- 1336 Tremont St
- 1328 W Highland St Unit 1334
- 1326 Tremont St
- 1334 W Tremont St Unit 1340
- 1041 N 14th St Unit 1043
- 1320 W Tremont St Unit 1332
- 1320 W Highland St Unit 1326
- 1015 N 14th St Unit 1025
- 1350 W Highland St
- 1332 Highland St